Abstract
It is a well-documented phenomenon that on average, women of all professions continue to earn lower yearly salaries than males who perform the same work. Terminal degree-holding faculty in the nation’s colleges and universities are no exception, although the degree to which these differences manifest depends on several factors such as academic discipline or rank, and exacerbated by the continued underrepresentation of females within the highest ranks of academe. Since faculty in the humanities already generally earn far less than most other academic disciplines, any systemic disadvantages to one gender presents a double penalty of sorts. This report describes the faculty composition and salary differences within male and female collegiate music faculty in schools accredited by the National Association of Schools of Music (NASM) from the last decade. Analysis of data from the annual Higher Education Arts Data Services (HEADS) revealed that females continue to be underrepresented as a whole within university faculty. While there is now a slightly more balanced ratio of male to female ranked faculty, there has been a disproportionate increase in the number of male contingent faculty. Data also showed that while salaries for females in rank were consistently lower than those of males across the study period, it was only by approximately 4% on average: a far more modest differential than many other academic disciplines.
The persistent wage gap between male and female salaries in the American workforce is a well-studied and highly documented phenomenon. Despite decades of research, this phenomenon is still far from being understood. Even now—well into the 21st century—females in all occupations continue to earn substantially less than their male counterparts doing the same work (Cress & Hart, 2009). Since females now represent nearly one-half of the overall American labor force (United States Department of Labor, 2014a), this reduction to purchasing power places a severe burden on the nation’s overall economic prosperity. Most recent federal estimates show the average American female worker earns approximately .79 cents for every dollar earned by males, a shortfall that can equal as much as $431,000 of lost earning potential over the course of a lifetime (National Equal Pay Task Force, 2014).
At the time the Equal Pay Act of 1963 was passed, the populations most affected by gender discrepancies in salary were those performing unskilled, low-wage labor, particularly black and Latino females. This is no longer the case, and parity is now closer for these populations. Today it is the most “highly educated and skilled women of all races and ethnicities” (National Equal Pay Task Force, 2014, p. 7) who report the greatest differences in salary. Terminal degree-holding faculty in the nation’s colleges and universities are no exception, although the degree to which these differences manifest depends on several factors in addition to gender. Wage gaps between male and female academics differ heavily by academic rank and discipline, with the greatest differentials in the uppermost ranks of STEM fields or other highly-compensated disciplines (Allan, 2011; Audrey Williams, 2009). These salary differentials are exacerbated by the fact that females continue to be underrepresented in academe, due in no small part to a) the relatively slow exit of a predominantly male cohort from the workforce; and b) the reluctance of universities to staff relatively expensive tenure-eligible faculty lines in the wake of the 2008 recession.
Many theories have been proposed attempting to explain the persistence of the wage gap and underrepresentation of females in academia. Most of these fall into one of two camps: a) human capital theories, which focus on ways in which individuals act rationally and according to their innate characteristics of skill set and life situation to provide, keep, or leave positions; and b) theories of cultural privilege maintenance, in which biases are explicitly or tacitly imposed on labor markets in ways that run counter to positive business practice (Aanerud, et al., 2007; Allan, 2011; Fairweather, 2005; Toutkoushian & Conley, 2005). The former is primarily an economic point of view, as when women voluntarily seek occupations which do not discourage female-centered needs. The supposition is that females may be drawn to (or away from) academia because it affords (or hinders) a healthy family-work balance; or because they accrue less experience during extended periods of family leave. The latter stems from feminist ideology, seen in studies on how women encounter direct opposition through institutional channels, gender-biased evaluations, lower negotiating power during tenure and promotion procedures, or outright workplace harassment that would discourage advancement (Marschke, Laursen, & Nielsen, 2007). There are many factors at play, and a universal solution is yet far on the horizon.
It is against this backdrop that the present research was conceived. There is an abundance of literature on how gender composition and salary presents itself across various academic disciplines, or higher education in aggregate (Allan, 2011; Audrey Williams, 2009; Bellas, Neal Ritchey, & Parmer, 2001; Chisholm-Burns, et al., 2012; Haignere, 2002; Longman & Lafreniere, 2012; Stephen, Robert, & John, 2008; Toutkoushian & Conley, 2005). However, there is much less detail on this phenomenon as it pertains specifically to collegiate music professors. The limited research in this vein was conducted before the turn of the millennium, in a far different economic and labor market than exists today. These early studies showed that there were strikingly few positions held by females: predominantly assistant professor rank or lower. Only a relative handful held full or associate professor ranks (Payne, 1996; Weaver, 1993). The purpose of the present research is to examine to what extent these characteristics; that is, faculty composition and the gender wage gap have changed (or not changed) since 2000. Do these longstanding issues continue to persist, or has progress been made?
Data for this study was drawn from the Higher Education Arts Data Services surveys (HEADS) between academic years 2000 through 2014-15. The HEADS data surveys are conducted by the National Association of Schools of Music (NASM), for which yearly completion is a mandatory requirement of an institution’s accreditation. The survey compiles self-reported data on a variety of measures, including the ethnic background of the student body, faculty compensation, and administrative expenditures. It is similar in vein to the national Integrated Postsecondary Education Data System (IPEDS) data surveys, except that it conveniently limits the population specifically to institutions accredited by NASM (N ≈ 575, varying by year). This distinction helps to eliminate potentially influential data from institutions with markedly different characteristics of faculty load or physical resources, for which prior research suggests the gender ratios and salary patterns differ than those in larger, more robust programs (Curtis & Thornton, 2013; Stephen, et al., 2008; Toutkoushian, 2000). However, this limitation reduces external generalizability. Any findings cannot be applied to the state of music faculty working in other, non-NASM accredited institutions.
The HEADS surveys categorize institutions based on several criteria. Relevant to the current research are those relating to the gender composition of faculty, an institution’s size, faculty length of time in service, number of faculty in any particular rank, and its institutional affiliation (either public or private exclusively; there is no unclassified or other category). The size category is based on the total number of enrolled majors during a given year, with a major defined as an undergraduate or graduate student enrolled in a program resulting in an Associate’s, Bachelor’s, Master’s, or Doctoral degree in a field of study that contains a minimum of 33% music content. This expanded definition allows for the inclusion of students pursuing degrees in music business, education, therapy, and some unspecified general liberal arts degrees as well as performance, composition, theory, or musicology degrees.
Composition of Accredited Music Faculty by Gender and Rank
There is general agreement that the wage gap in academia has been heavily influenced by the relatively slow entry of females into the uppermost ranks of academe (and the slow exiting of a predominantly male cohort from long-held terminal positions). This leads to a disproportionately low number of females who have had sufficient time and resources to attain the best compensated positions. While progress toward parity has been made over the last quarter century, the pace has been “excruciatingly slow” (Marschke, et al., p. 1). As an illustration, in 1972 only 27% of all university faculty were female, even including part-time positions. By 2013 this gap had narrowed, with the proportion of all ranked female faculty increasing to 43% of full-time positions. Still, only approximately 10% of these full-time positions were at full professor rank in doctoral-granting institutions (Thornton, 2014, pp. 35, Table 12). When considering all disciplines in aggregate, it is clear that progress has been made towards parity, although there are still areas of challenge. Females still continue to make up a) the largest proportion of lowest-paying positions, and b) the smallest proportion of overall faculty in institutions that have the most available resources (Marschke, et al., 2007).
Positions in music have followed similar trends. Despite the fact that females have been earning a greater number of terminal degrees in music post-2000, there are still a disproportionately low percentage of females hired to fill full-time tenure-track positions; an issue that has not yet been fully explained. Some authors imply this is due to outright bias in hiring and promotion practices—Payne (1996) bluntly suggests that much of the late 20th century’s systemic discrimination had been the result of hegemonic leadership who held the “assertion that few women are qualified to hold a tenure track position” (p. 93). There also has been longstanding concern that the slow progression of women through the academic ranks may be due in part to differences between the work duties of males and females. The typical workloads of female professors emphasize teaching and institutional service roles more prominently than research than males (Baker, 2012; Cress & Hart, 2009; Jacobs, 2004; Thornton, 2012; Winslow, 2010), which can present a substantial barrier for those attempting to earn full professor rank. It is projected that without substantive changes in hiring, promotion, and faculty-working practices, over 50 years will be needed before achieving parity (West & Curtis, 2006).
Has the gender composition of NASM-accredited faculty changed since the turn of the millennium? Two decades ago, Payne (1996) reported that females (N = 11,077) at the time made up only 24% of all university music faculty (including both accredited and non-accredited institutions). Within NASM-accredited institutions alone, 29% of faculty were reported as female (N = 8358). (An additional 189 (2%) ranked faculty were reported who were not specifically classified as either male or female by their institutions.) By 2015 this ratio had indeed equalized in accredited institutions, but only by a very small margin: 4% (68% male to 32% female).
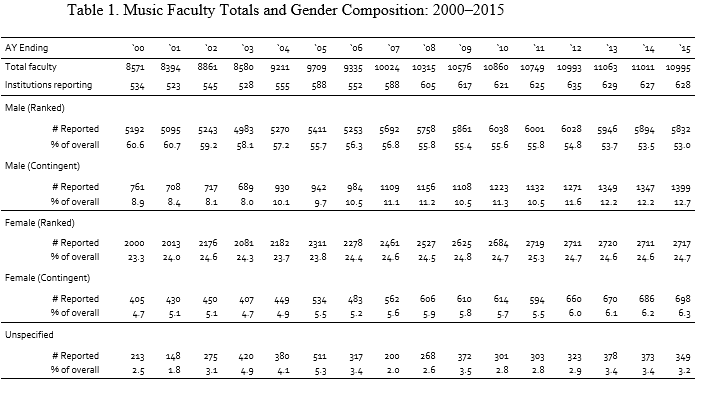
These ratios alone may not tell the full story. Higher education has seen an overall increase in faculty numbers at all ranks for both genders since 2000. In less than fifteen years, the number of accredited male faculty increased by 21% (from 5192 in AY2000 to 5832 in AY2015), but female faculty by 42% (from 2000 in AY2000 to 2717 in AY2015). These increases can easily be explained, at least in part, by a rise in the number of NASM-accredited institutions. While not the focus of this report, this increase is itself interesting. It may be that existing music programs have simply found it necessary to become accredited in order to compete for a shrinking pool of prospective students. Alternately, these may be newly established programs, which would suggest a commensurate increase in available full-time or contingent-level positions. Despite the increase in raw numbers, the overall ratio of male to female faculty in rank has remained a relatively steady 3:1 over the last fifteen years. These figures are summarized in Table 1.
Perhaps one of the most interesting phenomena can be seen in the rise in number of contingent faculty (i.e., lecturer, adjunct, and instructor positions). These unranked positions show one of the largest overall percentage increases post-2000. There has of late been much concern over higher education’s shift toward hiring contingent faculty lines as a lower-cost, lower-risk alternative to tenure track, so evidence of this in music should not be surprising. However, historically unranked contingent positions have been staffed by females, often without requiring that the individual carry a terminal degree (Curtis, 2011; West & Curtis, 2006). By contrast, the last fifteen years showed a surge in males being hired for contingent positions, far surpassing females. During the study period the number of males holding contingent positions nearly doubled from 761 to 1399, now representing 12.7% of the total faculty pool. Female contingent faculty similarly grew, but only by approximately 300 (a 72% increase). This remains a relatively low 6.3% of all reported faculty. This figure stands in stark contrast to the fact that terminal degree holders in music are now slightly more likely to be female (51%) (Higher Education Arts Data Services, 2014-2015).
Of course, this increase in contingent faculty reduces the ratio of ranked faculty in the overall population. Out of all reported faculty in 2000 (N = 8571), 5192 (60.6% of total) were males in rank (assistant, associate, or full professor), and 2000 (23.3% of total) were female in rank. By the end of the study period, the ratio of ranked male professorship in the overall population dropped over 7%, but surprisingly without a commensurate increase in the proportion of ranked females. This period represents the first time there have been more male non-contingent faculty than male assistant professors. See Figure 1 for a graphical representation of faculty composition across the study period by rank. These figures suggest that, while there appears to be a slightly more equitable distribution of females throughout the ranks now than there was fifteen years ago, neither males nor females are currently getting exactly where they ostensibly would want to be; that is, employed in ranked, full-time, tenure-track positions.
Salary Differentials by Rank, Gender, and Institutional Characteristics
While faring somewhat better than the national averages, females employed in higher education also earn only a percentage of what male faculty do: approximately 81%, when considering all faculty in toto. Interestingly, this figure has remained remarkably steady since studies of this nature began in the 1970’s1 (Bureau of Labor Statistics, 2011). When comparing male and female professors of the same rank, or for those in institutions that share similar characteristics such as size or institutional affiliation, the salary disadvantage to females is somewhat lessened. For instance, for females holding assistant or associate professor rank, average salaries are 7% lower than that of males—for the full professor rank, it is 12% (Curtis, 2011; Thornton, 2011).
One likely explanation for the continuing differential is that certain academic disciplines are simply compensated most generously than others (e.g., medicine, engineering, economics); further, these particular disciplines tend to have a larger proportion of male faculty (Ash, Carr, Goldstein, & Friedman, 2004; Committee on Women in Science Engineering Medicine, Committee on Gender Differences in the Careers of Science Engineering Mathematics, Committee on National Faculty Statistics Policy and Global Affairs, Division of Behavioral Social Sciences and Education, & National Research Council, 2010; DesRoches, Zinner, Rao, Iezzoni, & Campbell, 2003; Kite, et al., 2001; West & Curtis, 2006). Even more so than the humanities, these disciplines show males being disproportionally represented, particularly amongst the highest ranks. The underrepresentation of females manifests even more strongly as measures of institutional prestige increase (e.g., high student selectivity, Carnegie classification, amount of federal funding, research productivity, or student population) (West & Curtis, 2006). Since salaries of faculty in the humanities are already at or near the bottom of all disciplines, this sort of “prestige penalty” may in fact present female junior faculty in music with an additional burden.
While the raw salaries of accredited music faculty have risen steadily since 2000, the question remains as to the comparative purchasing power that these salaries offer. For instance, a $50,000 salary in 1970 is equal to earning $90,564.65 in 2014 due to inflation and other adjustments to the cost of goods and services. The question then becomes a) does the overall purchasing power of faculty salaries of the last fifteen years differ between in-rank males and females, b) to what degree (if any) have these differences changed over time, and c) how might these rates of change compare across gender or academic rank?
To answer these questions, the following three sets of salary data were drawn from HEADS surveys: a) the average of all reported salaries for that year (Average), b) the average of reported salaries at the 5th percentile rank (Low), and c) the average of reported salaries at the 95th percentile rank (High). Percentile ranks were chosen for analysis as a means of representing the upper and lower ranges of salaries while protecting against influential outliers. Salary data is based on a nine-month academic year excluding benefits. The calculations used to determine purchasing power are based on figures taken from the annual Consumer Price Index (CPI), published biannually by the U.S. Bureau of Labor Statistics. All wages were adjusted to appear as the equivalent buying power in 2014 dollars using standard Consumer Price Index (CPI) values (United States Department of Labor, 2014b). Academic rank was limited to tenure-eligible levels only (assistant, associate, full); adjunct, lecturer, or part-time status was not considered for the following analyses. There were no instances reported of individuals who did not self-identify as being either male or female.
Much of the data presented in these reports appears as averaged values across groups (and subgroups) of unequal sizes and variances, so their analysis and interpretation requires special consideration. In the HEADS survey structure, each individual institution reports overall salary expenditures and the number of faculty of predetermined classifications (e.g., female full professors, male associate professors) and institutional characteristics (e.g., small public universities, large private universities). To account for differences in group sizes between males and females at each rank, and between institutional characteristics mean salaries for each rank were calculated using weighted averages. There are no clear formulae to handle this particular data structure, so calculations were carried out using Stata 13’s aweights function, which is used when observations represent averages and assigns weights according to the number of elements that produce the average. Weighting values were calculated as the total number of institutions reporting for each category of institutional characteristic, multiplied by the number of individuals of each rank and gender from which salary data was averaged.
The weighted and CPI-adjusted salary data are presented in Figure 2, with average 5th%ile and 95th%ile are presented immediately following in Figures 3 and 4 (note right-hand scales are not equal).
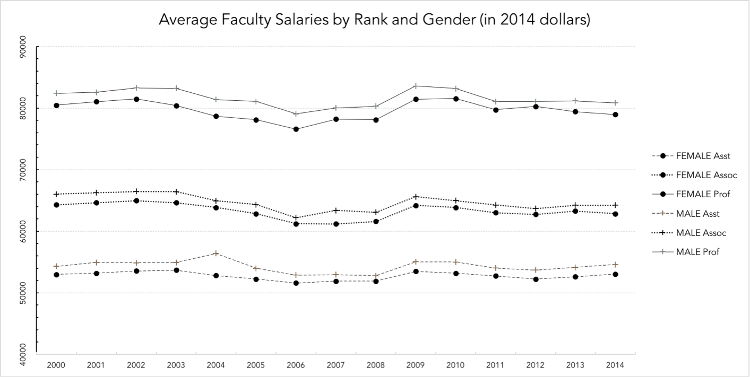
Figure 2
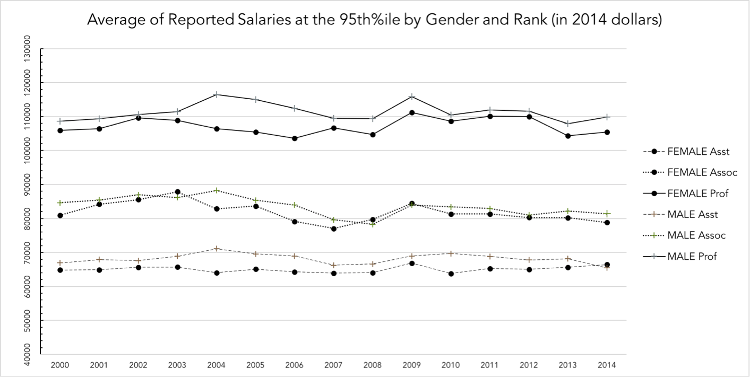
Figure 3
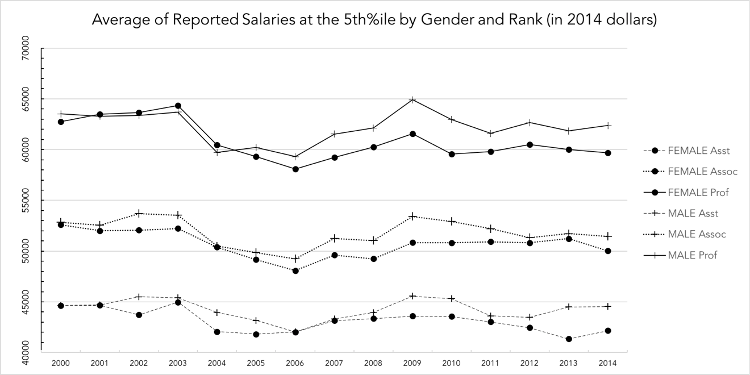
Figure 4
Visual inspection suggests two items: a) that the purchasing power of female salaries has been consistently lower than for males throughout the study period, and b) there is evidence of a slow downward trend in purchasing power for both genders at most ranks.
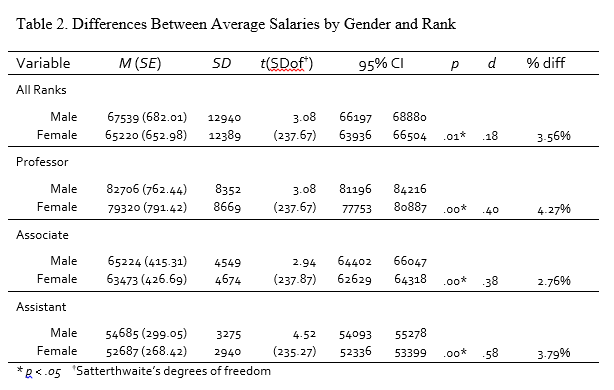
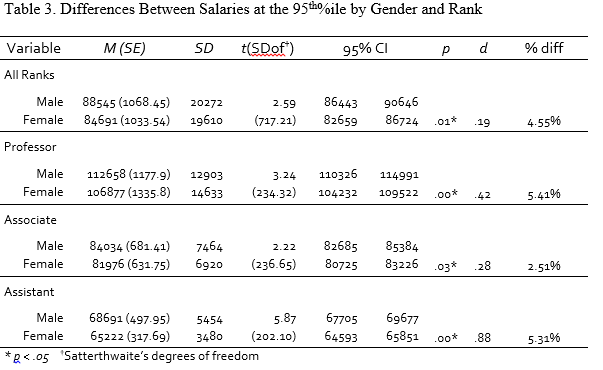
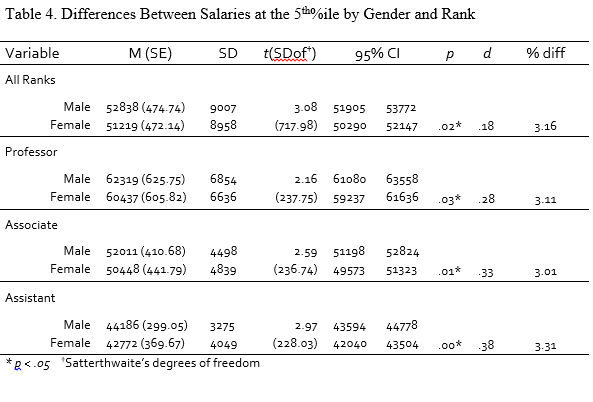
To determine whether the overall differences between the salaries of males and females were significant, weighted independent-samples t-tests were carried out on the pooled data set (thus disregarding the passage of time) using Satterthwaite adjustments for unequal group sizes and unequal variances, mirroring the process of a similar study by DeMaris (2004) of gender discrimination in faculty salaries. Results showed average male purchasing power to be significantly higher at all ranks; similar advantages can also be seen in the highest and lowest reported salaries for all ranks. Complete results are shown in Tables 2-4.
A simple pooled ordinary least squares estimation (OLS) was used to determine if there were any systemic changes across time. The OLS can be used in longitudinal contexts where clustering, autocorrelation, or correlated residuals may be of concern provided a) the correct covariates are included and the correct functional form is specified, and b) the residuals are uncorrelated with the covariates. Should either of these conditions not be met, the OLS can still provide consistent estimates of standard errors by using robust variance components estimation measures (“sandwich” estimators of the standard errors, in this case). Further, all subsequent analysis was performed on logarithmic transformations of salary data. This adjustment is common in analyses of salary data for two reasons: a) it helps to mitigate the natural positive skew that tends to accompany wage data, and b) it conveniently allows the resulting beta coefficients to be interpreted as percentage increases.
A separate regression model was fit for each rank and gender of the passage of time on reported salary. All results were non-significant, indicating no evidence of any systemic changes across time. The one exception was seen for female full professors for average reported salaries at the 5th%ile (see Figure 4). Here, the passage of time did significantly contribute to the model (F(1, 118) = 6.48, p = .01) with an R2 of .04, indicating that the equivalent purchasing power of the lowest salaries of female full professors have decreased by an average of $192 year-to-year (SE 75.38, 95%CI [-341.15, -42.60]), or by approximately .004% per year. This particular finding should be interpreted cautiously; given the small effect size it is possible this decrease is the byproduct of natural fluctuations.
A subsequent Z test was performed to determine whether or not the slope of this downward trend was significantly different than the slope for male full professors. The formula to calculate the significance of two regression coefficients is described by the following formula (Paternoster, Brame, Mazerolle, & Piquero, 1998).
The resulting Z value (Z = -1.81) was significant at the .05 level, indicating that the rate of decrease in the salaries of female full professors has been significantly greater than male full professors. There were no other significant differences found between the slopes of any other two ranks or genders. While an unexplained differential of 3-5% remains between male and female faculty, this trend does not appear to be changing either for the better or the worse, with the singular notable exception of the lowest paid female full professors.
Conclusion
The overarching patterns in wage data share some similarities with national trends, especially regarding the tendency of female salaries to be only a percentage of that of males in the overall work force. Others suggest that the profession of music teaching at the post-secondary level may be moving toward closing the wage gap. Trends over the last decade show that while females do consistently earn lower salaries than males (between 3-6% less), this difference is quite small in comparison to the 10% difference seen in the comparable population of all collegiate faculty and academic disciplines nationwide (Thornton, 2014). Of particular interest is the comparison between the salary patterns for the highest reported salaries to average and lowest reported salaries, especially regarding the differences between male and female full professors. The wages of female full professors have been historically less than that of full male professors, and there is some evidence to suggest that a significant, albeit small continuing downward trend is present. Reasons are unclear, but this particular pattern may be evidence of the salary compression that accompanies the extended employment periods of male full professors, compared with relatively recent entries of females to the highest ranks.
While parity may be approaching within our own profession, there is still much work to do in the broader scope of discipline-specific salary advantages, particularly for males. For NASM-accredited music faculty, males earn up to 11% less than the national average of all disciplines combined for their gender—compared with only 3-5% less for female NASM-accredited music faculty. No doubt this is due in part to the much higher salaries offered to other, more highly compensated disciplines that are predominantly male.
This slow advancement toward parity in the highest ranks stands in stark contrast to the rapidly growing population of new female terminal degree holders, which for the class of 2013 was a record 51% of college graduates. The gender ratio of new contingent hires should ostensibly reflect the composition of newly minted graduates in music, yet this appears to not be the case. Since the economic recession of 2006–2009, universities have been steadily decreasing the number of available tenure-track jobs in favor of lower paying part-time, adjunct, or other non-tenure track faculty, positions that already have been predominantly female (Curtis & Thornton, 2011; Dunn, 2013). The majority of these new hires will be competing for what would seem to be an increasingly limited number of available entry-level and junior positions. Over the last fifteen years, the number of males hired for non-tenure track positions appear to be outnumbering females by 3 to 1. Therefore, it would appear that over the next decade there will be more females entering a labor market that has a) fewer available positions that carry the possibility of rank advancement, and b) more low paying positions that offer little to none.
Because academic disciplines and departments enjoy great autonomy when establishing faculty wages, bias in compensation and salary structure can be easily introduced via the same features that provide higher education with its ability to compete for talent in a free market. Recent studies suggest that gender biases, even within the most egalitarian individuals are most likely the result of repeated exposure to pervasive cultural stereotypes that “portray women as less competent but simultaneously emphasize their warmth and likeability compared with men” (Moss-Racusin, Dovidio, Brescoll, Graham, & Handelsman, 2012, p. 16474) and neither males nor females are exempt. The ability of a new hire to negotiate (Bowles, Babcock, & Lai, 2007; Kray & Thompson, 2004), or the marketability of an academic profession all play roles in determining equitable compensation. Given the degree to which starting wages influence overall salary trends over a faculty member’s career, even small differences can make substantial differences over a lifetime. Therefore, continuing to keep a proverbial “eye on the ball” regarding gender equity in our profession is an essential part of preserving a vibrant national economy, and maintaining a satisfied—and therefore more productive—academic workforce.
Notes
1An exception occurs during the national recession of 2006–2008 where all faculty salaries showed negative growth for a two-year period, not fully recovering until 2012. In 2006, the average salary for faculty women was 80.68% that of men; in 2013, it had dropped slightly to 80.57%—$75,874 for women; $94,174 for men (Curtis & Thornton, 2013).
References
Aanerud, R., Morrison, E., Homer, L., Rudd, E., Nerad, M., & Cerny, J. (2007). Widening the Lens on Gender and Tenure: Looking Beyond the Academic Labor Market. National Women's Studies Association Journal, 19(3), 105-122.
Allan, E. J. (2011). Women's Status in Higher Education: Equity Matters: John Wiley & Sons.
Ash, Carr, Goldstein, & Friedman. (2004). Compensation and advancement of women in academic medicine: Is there equity? Annals of Internal Medicine, 141(3), 205.
Audrey Williams, J. (2009). Professors' Pay Raises Beat Inflation; So Much for the Good News. The Chronicle of Higher Education, 55(32), n/a.
Baker, M. (2012). Academic careers and the gender gap. Vancouver: UBC Press.
Bellas, M. L., Neal Ritchey, P., & Parmer, P. (2001). Gender Differences in the Salaries and Salary Growth Rates of Universtiy Faculty: An Exploratory Study. Sociological Perspectives, 44(2), 163-187.
Bowles, H., Babcock, L., & Lai, L. (2007). Social incentives for gender differences in the propensity to initiate negotiations: Sometimes it does hurt to ask. Organizational Behavior and Human Decision Processes, 103(1), 84–103. doi:10.1016/j.obhdp.2006.09.001
Bureau of Labor Statistics. (2011). Women in the Labor Force: A Databook. (1034), 98. Retrieved from http://www.bls.gov/cps/wlf-databook-2011.pdf
Chisholm-Burns, M. A., Spivey, C. A., Billheimer, D., Schlesselman, L. S., Flowers, S. K., Hammer, D., et al. (2012). Multi-institutional study of women and underrepresented minority faculty members in academic pharmacy. American Journal of Pharmaceutical Education, 76(1), 7-7.
Committee on Women in Science Engineering Medicine, Committee on Gender Differences in the Careers of Science Engineering Mathematics, Committee on National Faculty Statistics Policy and Global Affairs, Division of Behavioral Social Sciences and Education, & National Research Council. (2010). Gender Differences at Critical Transitions in the Careers of Science, Engineering, and Mathematics Faculty: National Academies Press.
Cress, C., & Hart, J. (2009). Playing Soccer on the Football Field: The Persistence of Gender Inequities for Women Faculty. Equity & Excellence in Education, 42(4), 473-488. doi: 10.1080/10665680903284523
Curtis, J. (2011). Persistent Inequity: Gender and Academic Employment. Speech. American Association of University Professors. Retrieved from http://www.aaup.org/NR/rdonlyres/08E023AB-E6D8-4DBD-99A0-24E5EB73A760/0/persistent_inequity.pdf
Curtis, J., & Thornton, S. (2011). A Very Slow Recovery. The Annual Report on the Economic Status of the Profession, 2009 - 10. Academe, 96.
Curtis, J., & Thornton, S. (2013). Losing Focus: The Annual Report on the Economic Status of the Profession. Academe. Retrieved from http://www.aaup.org/file/zreport.pdf
DesRoches, C. M., Zinner, D. E., Rao, S. R., Iezzoni, L. I., & Campbell, E. G. (2003). A "ton of feathers": gender discrimination in academic medical careers and how to manage it. Journal of Women's Health- New York, 12(10), 1009-1018. doi: 10.1089/154099903322643938
Dunn, S. (2013). As Public-Private Pay Gap Widens, State Universities Try to Hang On to Faculty. The Chronicle of Higher Education.
Fairweather, J. S. (2005). Beyond the Rhetoric: Trends in the Relative Value of Teaching and Research in Faculty Salaries. The Journal of Higher Education, 76(4), 401-422. doi: 10.2307/3838846
Haignere, L. (2002). Paychecks. Washington, D.C.: American Association of University Professors.
Higher Education Arts Data Services. (2014-2015). Music Data Summary. Reston, VA: National Association of Schools of Music.
Jacobs, J. (2004). The academic life course, time pressures and gender inequality. Community, Work & Family, 7(2), 143-161. doi: 10.1080/1366880042000245443
Kite, M. E., Russo, N. F., Brehm, S. S., Fouad, N. A., Hall, C. C. I., Hyde, J. S., et al. (2001). Women psychologists in academe: Mixed progress, unwarranted complacency. American Psychologist, 56(12), 1080-1098. doi: 10.1037/0003-066X.56.12.1080
Kray, L., Thompson, L. (2004). Gender stereotypes and negotiation performance: an examination of theory and research. Research in Organizational Behavior, 26, 103–182. doi:10.1016/S0191-3085(04)26004-X
Longman, K. A., & Lafreniere, S. L. (2012). Moving Beyond the Stained Glass Ceiling: Preparing Women for Leadership in Faith-Based Higher Education. Advances in Developing Human Resources, 14(1), 45-61. doi: 10.1177/1523422311427429
Marschke, R., Laursen, S., & Nielsen, J. M. C. (2007). Demographic inertia revisited: An immodest proposal to achieve equitable gender representation among faculty in higher education. The Journal of Higher Education, 78(1), 1-26. doi: 10.1353/jhe.2007.0003
Moss-Racusin, C. A., Dovidio, J. F., Brescoll, V. L., Graham, M. J., & Handelsman, J. (2012). Science faculty's subtle gender biases favor male students. Proc Natl Acad Sci U S A, 109(41), 16474-16479. doi: 10.1073/pnas.1211286109
National Equal Pay Task Force. (2014). Fifty Years After the Equal Pay Act. whitehouse.gov, from http://www.whitehouse.gov/sites/default/files/equalpay/equal_pay_task_force_progress_report_june_2013_new.pdf
Paternoster, R., Brame, R., Mazerolle, P., & Piquero, A. (1998). Using the Correct Statistical Test for the Equality of Regression Coefficients. Criminology, 36(4), 859-866. doi: 10.1111/j.1745-9125.1998.tb01268.x
Payne, B. (1996). The Gender Gap: Women on Music Faculties in American Colleges and Universities 1993-1994. College Music Symposium, 36, 91-102.
Stephen, R. P., Robert, K. T., & John, V. M. (2008). Pay Inequities for Recently Hired Faculty, 1988-2004. The Review of Higher Education, 31(4), 465-487. doi: 10.1353/rhe.0.0014
Thornton, S. (2011). It's Not Over Yet. Academe, 97(2), 4-36.
Thornton, S. (2012). The Annual Report on the Economic Status of the Profession, 2011-12. [Article]. Academe, 98(2), 1-1.
Thornton, S. (2014). The Annual Report on the Economic Status of the Profession, 2013-14. [Article]. Academe, 100(2), 1-1.
Toutkoushian, R. K. (2000). Addressing gender equity in nonfaculty salaries. Research in Higher Education, 41(4), 417-442.
Toutkoushian, R. K., & Conley, V. M. (2005). Progress for women in academe, yet inequities persist: Evidence from NSOPF: 99. Research in Higher Education, 46(1), 1-28.
United States Department of Labor. (2014a). Data and Statistics: Latest Annual Data. Women's Labor Retrieved June 28, 2014, 2014, from http://www.dol.gov/wb/stats/recentfacts.htm
United States Department of Labor. (2014b). Historical Consumer Price Index for All Urban Consumers Retrieved June 28, 2014, 2014, from http://www.bls.gov/cpi/cpid1405.pdf
Weaver, M. (1993). A survey of Big Ten Institutions: Gender distinctions regarding faculty ranks and salaries in schools, divisions, and departments of music. The Quarterly Journal of Music Teaching and Learning(Winter, 1993), 91-99.
West, M., & Curtis, J. (2006). AAUP Faculty Gender Equity Indicators 2006. Washington, DC: American Association of University Professors.
Winslow, S. (2010). Gender Inequality and Time Allocations Among Academic Faculty. Gender and Society, 24(6), 769-793. doi: 10.1177/0891243210386728


