
Abstract
This study conducts a statistical analysis that reveals the presence of clearly defined characteristics among audio logos and assesses the inherent musical meanings of those audio logos. Inspired by the seminal work of Theo Van Leeuwen (1999), this work focuses on an in-depth analysis of a large sample of audio logos (n=196) that has been transcribed and analyzed in terms of sonic modality cues from a compositional perspective. For readers who do not have a formal musical background, the results are illustrated with many visual and numerical outputs, as well as audio samples. This work is intended for those interested in audio branding and audio logos, and is a framework for academics and professionals interested in the musicological analysis of a song or a tune using sonic semiotics, for those who conduct market research on how consumers judge sounds and relate to musical pieces, and the associations that are elicited by such pieces.
This research was made partly possible thanks to a generous Faculty Research Grant from the Music & Entertainment Industry Educators Association. (MEIEA)
1.0 Introduction
For the past 20 years, corporations have positioned music at the center of their marketing mix to engage their customers, understanding that marketing is a conversation, and that music is one of the most important triggers to generate word of mouth (WOM) around the brand and its products (Luzensky 2010, 10). Corporate brands then realized that audio logos helped create true loyal fans of their brands. McDonald’s is an excellent example of a company that has worked with sonic branding for more than 20 years and today, everyone recognizes McDonald’s audio logo: “Da da da da dah, I’m loving it” (See Figure 1 and Audio File 1). Audio logos, also commonly known as sound logos, have played a significant role in shaping corporate sound branding globally for hundreds of companies (See Table 2). By definition, an audio logo is a brand’s signature or ‘identifier’, but most importantly it has a powerful sonic mnemonic function often associated with a visual logo (Bruner 1990, 94; Wallace 1991, 240; Bronner 2009, 78; North, Hargreaves and McKendrick 1999, 271; and Forceville 2008, 279). Forceville goes as far as calling audio logos a ‘metaphor’ in regards to their ‘target domain’.
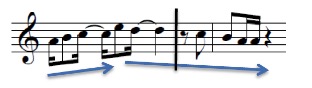
Figure 1. McDonald’s Audio Logo
Audio File 1
Audio logos are also an exceptional and unique musical form, playing an idiomatic role in society. They are recognizable by millions of people around the world, thus, making them currently one of the most popular music genre. Audio logos can be heard in countless commercials as an integral part of the eco-system that is popular culture and are embedded in our subconscious. And yet, audio logos are not being consumed as an art form or streamed on platforms such as Spotify or Pandora. Instead, they are heard in the advertisements that support such services.
2.0 Audio Logos and Modality Cues
The focus of the current study is to analyze sonic elements known as modality cues within a large sample of audio logos. The objective of this analysis is to document what range of characteristics audio logos typically occupy, why that is, and how they impact listeners. Modality cues as a mean to analyze musical samples were first introduced by the semiotician Theo Van Leeuwen in 1996. According to Van Leeuwen, ‘modality’ originates from the fields of linguistic, logic, social, semiotic, and visual communication (Van Leeuwen 1999, 156-159). As a first step to adapt modality to sound, Van Leeuwen and co-author Gunther Kress applied this concept to visual communication (Van Leeuwen 1996, 157). They generated ‘degrees’ that were specific to the requirements of images such as the degrees of the articulation of detail, articulation of the background, color saturation, color modulation, color differentiation and so forth (Van Leeuwen 1996, 159). Following a similar approach, Van Leeuwen then developed a set of ‘modality cues’ and ‘coding orientation’ to approach the analysis of musical samples. An overview of his ‘sonic modality cues’ system is shown in Figure 2.
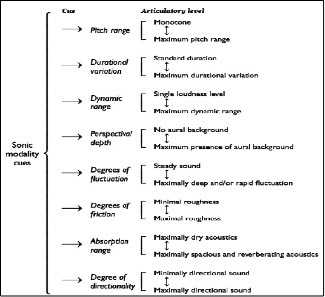
Figure 2. Theo Van Leeuwen’s Sonic Modality Cues
Many other systematic methods to analyze audiovisual products and texts exist as well. However, those systems aim to assess the connection and possible interaction between visual, audio, and the textual elements of brands. Instead of modality cues, terms such as ‘media’, ‘modes’, ‘sensory modalities’, ‘semiotic systems’, ‘resources’, and ‘components’ are commonly used among semioticians (Constantinou 2005, 606-611; Bundsgaard 2005, 54-85; Lauer 2009, 227-229; and Boeriis 2009, 64-67). Bonde and Grutt Hansen explain that the terminology depends largely on ‘conventions of the scholarly field’ where research is conducted (Bonde and Grutt Hanse 2013, 113-114). Several other academics went on to define the conventions of ‘separability’ or the ‘self-sufficiency’ of the semiotic systems (Levinson 1984, 8; Hoek 1995, 66-67, and Mitchell 2005, 278). According to them, the semiotic systems attempted to identify the constituent elements of moving images, verbal messages and music as unique ‘individual entities’. For an in-depth literature review on the topic of semiotic systems and their ‘denotational’ and/or ‘referential differences’, and the ‘mapping’ between the different systems, please refer to Bonde and Grutt Hansen (Bonde and Grutt Hansen 2013, 114-117).
The aim of this study is not to cover the topic of ‘translational’ or ‘transmutational’ work in audio branding. Instead, this article intends to focus on assessing whether common attributes are present amongst audio logos and what meaning is conveyed by those cues. Also, please note that the scope of this study will encompass more than just traditional audio logos. Like visual animated logos, audio logos are acoustic signals short in duration - typically less than six seconds, which may use instruments, voice, sample sounds or synthetic sound effects, also known as sound design. The author of the present study considers that other forms of sound identity, also known as Sound ID, should fall under the category of audio logo such as jingles, sound icons, and sound symbols. The Southwest Airlines Intercom sound for instance is an audio logo (See Figure 3 and Audio File 2) but can also be considered as a sound icon.
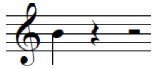
Figure 3. Southwest Airlines ‘Intercom’ Audio Logo
Audio File 2
Sound icons tend to be the shortest sound component of sound branding. They often play the role of an ‘auditory user interface’ also known as an ‘auditory icon’ (Audio Branding Academy 2016)1. In contrast to sound icons, sound symbols are sound items that have no translational connection to the brand they associate with, thus do not bear a similarity to the object to which they refer (See Figure 4 and Audio Files 3 + 4).
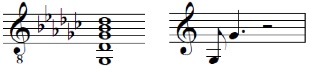
Figure 4. Sound Icon of Apple (on the left) and Facebook (on the right)
Audio File 3
Audio File 4
As long as samples are shorter than six seconds, all of the aforementioned elements of sound branding are included in this study under the audio logo umbrella. An example of a jingle that falls under that category is the Haribo jingle/audio logo (See Figure 5 and Audio File 5). The Haribo audio logo is indeed a jingle with the following words in French and German respectively: “Haribo, C’est Bon La Vie, Pour Les Grands Et Les Petits”; “Haribo Macht Kinder Froh, und Erwachsene Ebenso”. It is less than six seconds in length and is inherent to the sonic brand of the confectionery company, and thus is considered as an audio logo for the scope of this study. Brand songs and brand soundscapes are however not treated here as they are too lengthy (usually much longer than six seconds) and thus would generate skewed results.
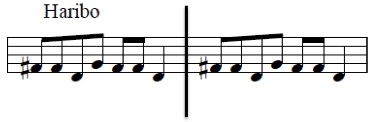
Figure 5. Haribo Audio Logo
Audio File 5
Many audio logos are melodic in nature, while others can contain a single sound effect such as the Southwest Airlines Intercom Sound (See Figure 3 and Audio File 2) or a complex combination of the elements such as the Microsoft Surface audio logo (See Figure 6 and Audio File 6). Southwest Airlines’ audio logo cleverly uses the intercom tone that is an integral part of the flying experience, whereas Microsoft utilizes a much more complex path combining vertical and horizontal pitches as well as a wind sound effect for its Surface’s sound symbol.
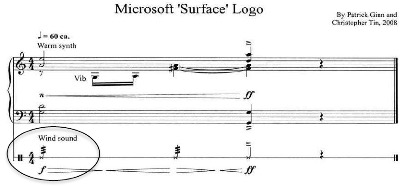
Figure 6. Microsoft ‘Surface’ Audio Logo2
Audio File 6
Bonde and Grutt Hansen, Ringe, Raffaseder, and Bronner, emphasized that audio logos are probably most efficient as a brand signifier when put in a melodic form rather than as a sound design (Bonde and Grutt Hansen 2013, 114, Ringe 2009, 136-137; Raffaseder 2009, 97-98; and Bronner 2009, 78). They state that the latter permutation has severe creative limitations when integrated in a ‘consistent and continuous’ branding campaign. To reinforce their claim, several theoreticians and practitioners support that ‘flexibility’ is a key component for an audio logo to be successful (Bronner 2004, 39-40; Groves 2007, 135-147; Hofer 2009, 57-58). They advocate for simplicity, uniqueness, a melodic approach, distinctiveness, adaptability between platforms (i.e. phone line vs. television or radio commercial), recognisability, memorability and fit for the corporate brand. The present study will provide empirical evidence supporting simplicity and the use of a melodic approach in audio logos. This work will also provide important clues as to what attributes are available to increase the uniqueness and distinctiveness of audio logos.
Another stream of research generating a great deal of attention links the audio logo fit to brand. This is not the intent of this study to do so. Instead, the author wishes to establish a framework that would enhance such studies. In addition, audio logo fit to brand is best treated in a case study format. For those interested in case by case applications, about 50 such case studies are readily available from the Audio Branding Academy3.
3.0 Methodology
As aforementioned, the focus of this study is to produce a statistical analysis of a large sample of audio logos (n=196) to assess the presence of common attributes amongst audio logos. The author was mainly inspired by the work of Van Leeuwen, but the transcriptions and analysis of the present empirical study required more specific modality cues that were further adapted to match the needed requirements. The cues employed in this study that were borrowed from the Van Leeuwen system included the pitch range, durational variation, degrees of friction, and degrees of directionality (See Figure 2). Only modality cues from Van Leeuwen’s system that were related to the fundamental composition process of the audio logos were taken into consideration. Other modality cues belonging to the realms of arranging, orchestration, and production were not considered central to this study. Thus, to adapt the modality cues system presented by Van Leeuwen, the sonic modality cues that were collected and processed for this study included the number of events, number of pitches, pitch range as ambitus, intervallic directional change, durational changes, structural units in terms of phrasing, meter, tonal/modal polarity or finality, mode (major, minor, or other), and resolution (open ended or closed in term of tonal finality – degrees of friction modality cue) (See Table 1). In addition, the analysis of these cues is then combined with a non-linear social network analysis taking in consideration only the sequential pitches of each of the final transcribed sample n=196 (See Table 2 and Appendix A).
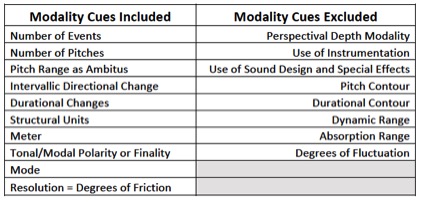
Table 1. List of Sonic Modality Cues Included and Excluded from the Methodology
3.1 Transcriptions
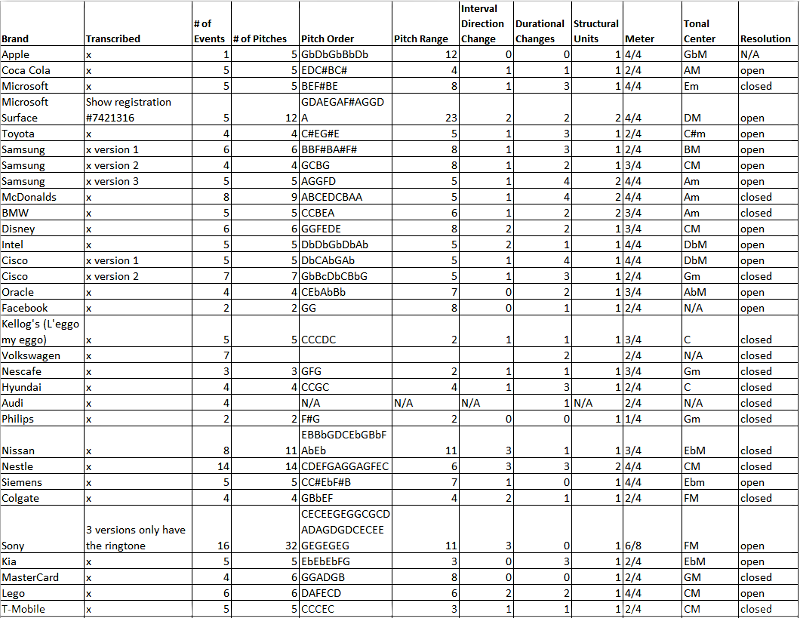
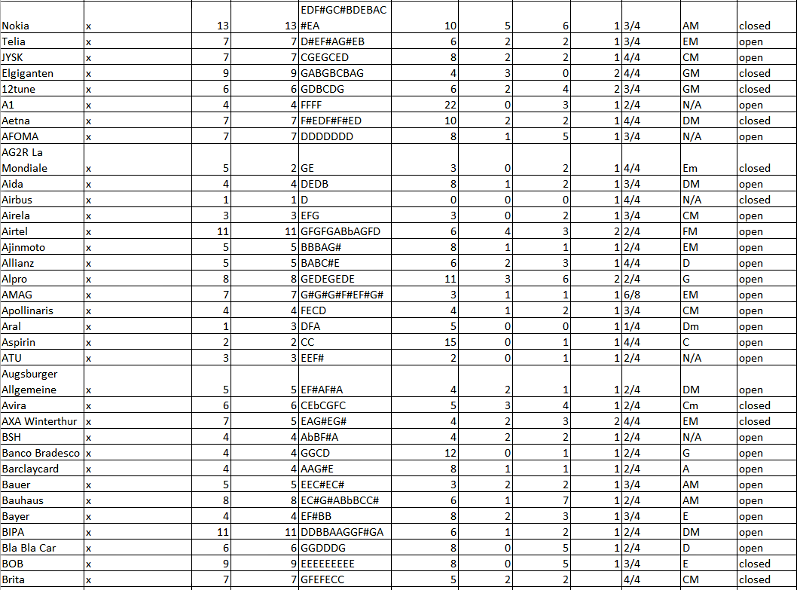
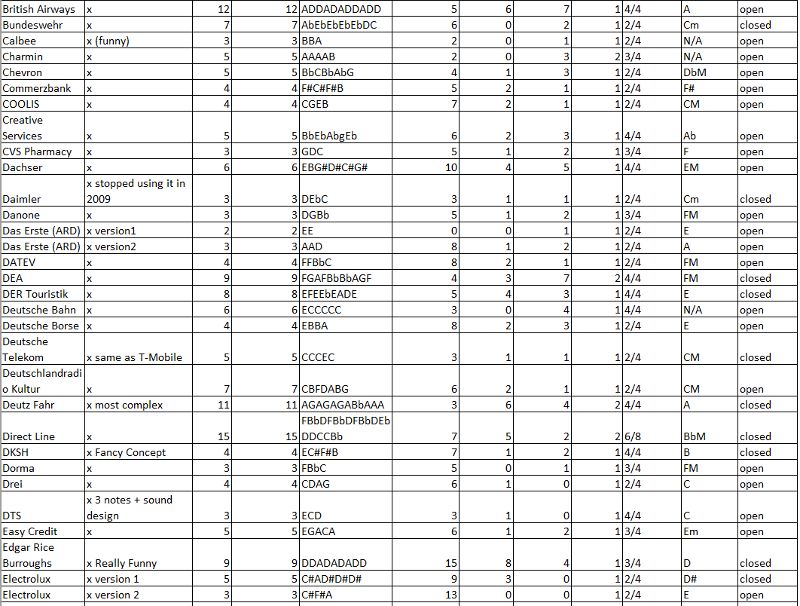
The author sourced over 339 audio logos, analyzed 269 out of those 339 and from that sample 196 were successfully transcribed. The other 74 audio logos were very complex scores, sound designs, or sound effects with no recognizable pitches. The Dolby Digital Audio Logo is an example of a notation file submitted to trademark offices in an unintelligible format (See Figure 7 as patented with the United States Patent and Trademark Office (USPTO), and the European Union Intellectual Property Office (EUIPO)4). Besides, a sonic modality cue analysis of sound effects and sound designs is beyond the scope of this study. For a complete list of the transcribed audio logos, see Table 2, and for transcription data, refer to Appendix A. Also, please note that some of the brands listed had several versions, marked as version 1, version 2, and so forth.
Figure 7. Dolby Digital Audio Logo Notation File
Home countries of the corporations associated with the brands (See Table 2) are shown in Figure 8. Germany and the United States are heavily represented in this sample, respectively the fourth and first economies in the world.5 German companies are conscientious about their sonic identity and it is, thus, no surprise that the academic center that is the Audio Branding Academy (ABA) specializing in audio branding is hosted in Hamburg, Germany. Figures 8 and 9 also show that the transcribed sample is well diversified in terms of industry sectors and does represent companies and brands that span the globe, thus reducing result bias. Amongst the top industry sectors seeking a unique sonic branding identity via the creation of an audio logo are the food and drink industry, financial and business services, chemicals, health care, and energy, the automotive industry, film and entertainment, and transport, followed closely by technology, retail and the electronics market. Note that those sectors deal with particularly intense competition, and thus, require a clear audio identity to stand out in the eyes (and ears) of potential consumers.
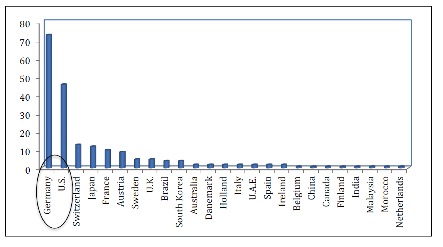
Figure 8. Transcribed Audio Logo Sample Organized by Countries (by count)
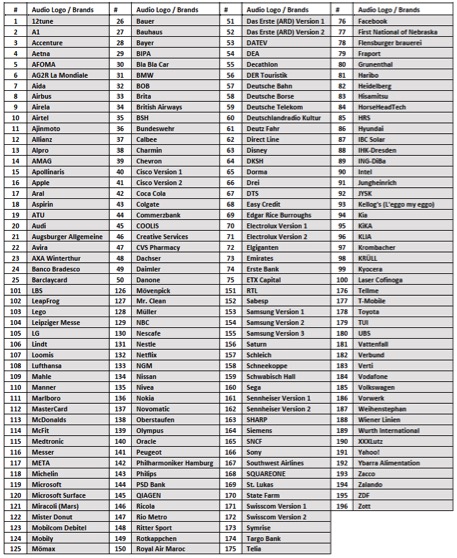
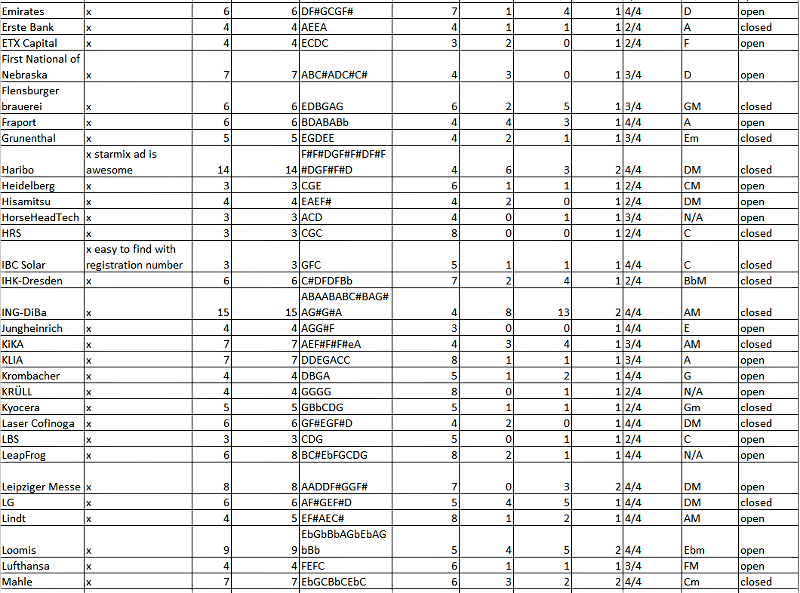
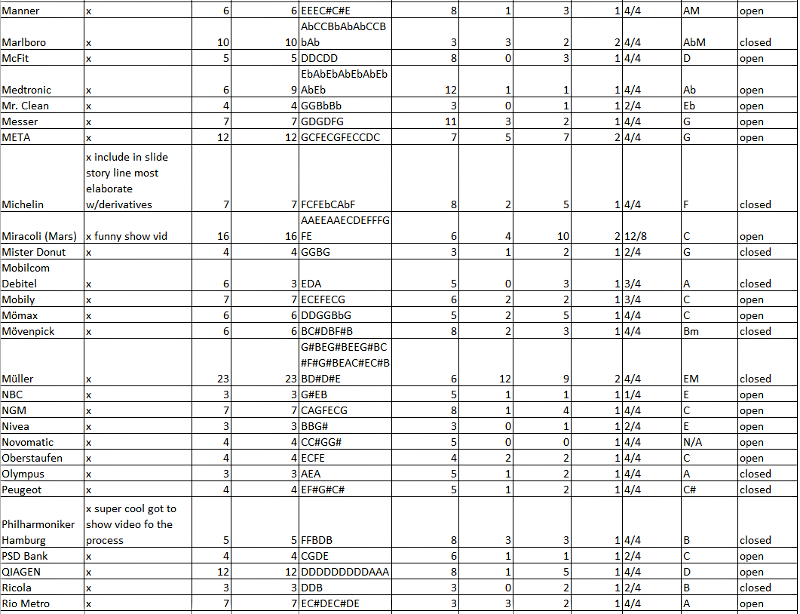
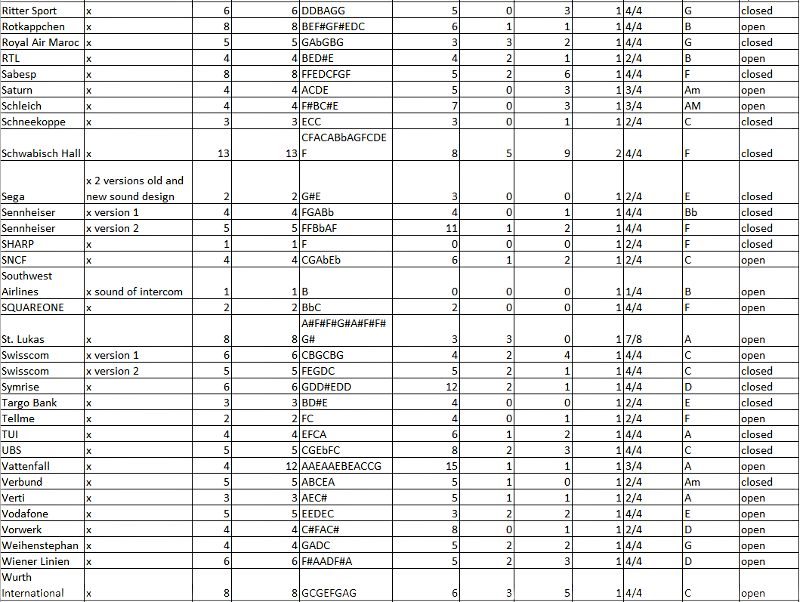
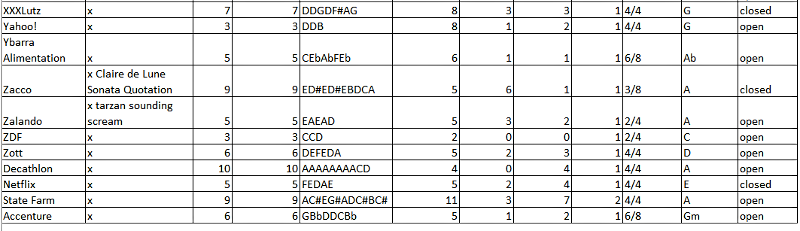
Table 2. Audio Logo Transcription List for Sample n=196
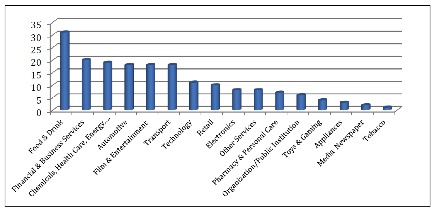
Figure 9. Transcribed Audio Logo Sample Organized by Industry Sector
4.0 Analysis
The analysis presented next is conducted in seven parts to offer a comprehensive understanding of the scope of the 196 audio logos treated in this study. In addition, in each section of this analysis, the meaning of each modality cue will be explained to increase the understanding of the musical processes, thus, answering why audio logos have those characteristics.
4.1 Events Count, Pitch Count and Pitch Range
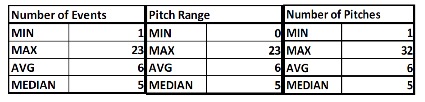
Table 3. Number of Events, Pitches and Pitch Range for Sample n=196
The number of events indicates how many sounds were heard in any given audio logo. Thus, according to Table 3, the shortest audio logos had only one event (one sound). Please note that there is a clear distinction between an ‘event’ and a ‘pitch’. For instance, a percussive sound or a prerecorded sound may not have a discernible pitch but that sound still counts as an event. Table 3 also presents the reader with the MIN (minimum occurrence), MAX (maximum occurrence), AVG (mean), and the median. MIN stands for the smallest or shortest number of events, number of pitches and pitch range incurred by an audio logo, whereas the MAX field is the opposite and informs the reader of the maximum number of events, pitches, and pitch range incurred also known as interval recorded in any audio logo. Two other revealing fields are proposed, the mean (AVG) of the sample (n = 196) and the median. The median is perhaps the most statistically relevant field presented here. Note that the event median is 5, so are the pitch number and pitch range. This means that most audio logos tend to be composed with 5 sounds, 5 pitches and have an ambitus or pitch range within the range or ambitus of a fifth (See Figure 10 and Audio File 7). Those results inform us that most audio logos tend to be 5 events in length and contained within a relatively limited pitch range. For a pitch range to be present in an audio logo, at least two events with different pitches or the same pitch at a different register are required. The A1 audio logo is a perfect example of a pitch range created by the same pitch at a different register (See Figure 11 and Audio File 8).
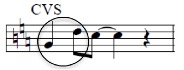
Figure 10. CVS Audio Logo featuring the pitch range of a ‘fifth’ (interval)
Audio File 7
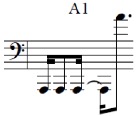
Figure 11. A1 Audio Logo featuring a huge Pitch Range/Ambitus
Audio File 8
On the extreme opposite end, the maximum set of events presented within the sample transcribed is 23 (See Figure 12 and Audio File 9), with one occurrence of an audio logo with 32 pitches (See Figure 13 and Audio File 10) and another with a pitch range of 23 or over 3 octaves (See Figure 11 and Audio File 8). Those extreme examples are rarities and outliers of the sample treated.
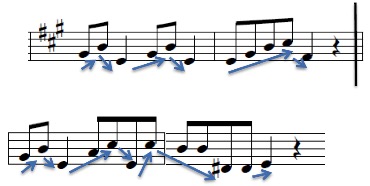
Figure 12. Müller Audio Logo
Audio File 9
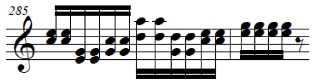
Figure 13. Sony Audio Logo (Ringtone)
Audio File 10
The scatter diagrams plotted below present a visual outlook of data n=196 in terms of events, pitches, and pitch range (See Figure 14, 15 and 16). Note how most audio logos clusters are under the 10 events and pitches line. Some data points are present beyond that threshold but are
statistically outliers. The audio logos containing over 10 pitches and/or events tend to be jingles with two structural units and often contain a vertical cluster of pitches that often takes the form of a chord. The Apple audio logo is an example of a vertical pitch cluster as a chord (See Figure 4 and Audio File 3). Another condensed vertical cluster of pitches can be seen in the Sony audio logo (See Figure 13 and Audio File 10). Pitch range tends to remain within an octave range (<8), such as the Facebook audio logo contained in an octave from low ‘G’ to high ‘G’ (8 note interval) pitch range (See Figure 4 and Audio File 4). However, most audio logos congregate around the pitch range of a fifth (See Figure 16).
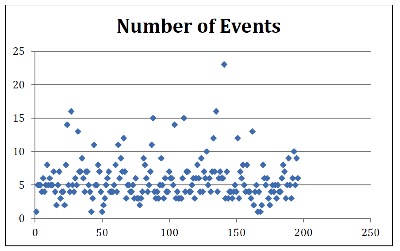
Figure 14. Number of Events - Scatter Diagram for Sample n=196
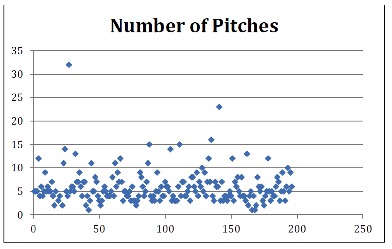
Figure 15. Number of Pitches - Scatter Diagram for Sample n=196
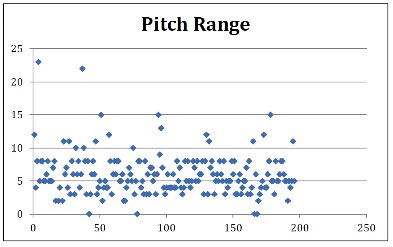
Figure 16. Pitch Range Scatter Diagram for Sample n=196
Why is it important for audio logos to revolve around 5 events/pitches and to occupy the range of the interval of a fifth? Recall and the prominence of the micro-moment culture are the most obvious answers6 7. Companies such as Google and Apple introduced the concepts of micro-moments, a time frame shorter than the present, about 3 seconds (Adams, Burkholder, and Hamilton, 2015). This is a topic that has not yet been covered by academicians to the degree that it deserves. However, the music industry is well-aware of that phenomena. Indeed, audio logo designers understand that the time spam of advertisements shrunk significantly in the past 20 years and that corporations had to adapt to this time compression limiting the delivery of their message to their consumers (See Figure 17). Long jingles and theme songs are not an alternative anymore, with Youtube ads allowing a maximum length of 15 seconds with a 5 second skip option offered to viewers in many instances. Commercials wishing to incorporate a sound ID into their spots had to do so within that time constraint. The listeners and consumers are now in charge and the era of long TV commercials being imposed on the viewers are being threatened by many preferred streaming alternatives. In addition to being micro-moment aware, audio logo designers’ main objective is to create product that easily will enable recall by listeners. Thus, for anyone to hum or reproduce (sing) an audio logo, it must be brief, memorable, and within a singing range that is accessible for most.
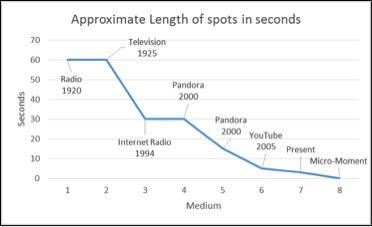
Figure 17. Length Decrease in Advertisement Spots Allocations Over Time by Mediums
4.2 Intervallic and Durational Changes
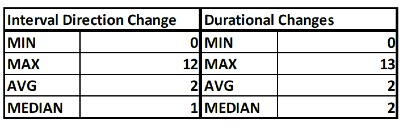
Table 4. Intervallic and Durational Changes for the Sample n=196
After considering the static number of pitches, events and pitch range, this section of the analysis considers the moving aspects of intervallic directional changes and durational changes. Intervallic changes are general directional changes (ascending vs. descending) in the melody of a given audio logo. For example, McDonald’s audio logo (See Figure 1 and Audio File 1) shows only one intervallic change. Once the melody finishes ascending to the higher note E, it then descends. In terms of sonic modality cues, this is one intervallic change. The intervallic directional table indicates that the median intervallic change as learned from the sample n=196, is 1 (See Table 4). The McDonald’s audio logo (See Figure 1 and Audio File 1), the CVS audio logo (See Figure 10 and Audio File 7) and T-Mobile audio logo (See Figure 18 and Audio File 11) fit that same pattern.
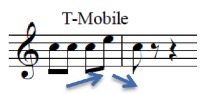
Figure 18. T-Mobile Audio Logo
Audio File 11
An extreme version of an intervallic change can be seen in the Müller audio logo (See Figure 12 and Audio File 9). Note how 12 upward and downwards successive motions are indicated by the arrows. Again, this is a rarity amongst audio logos as learned from the sample. To reinforce this analysis, the scatter diagram below plots the transcribed sample in terms of intervallic directional changes (See Figure 19). A seen in this diagram, most audio logos treated here take advantage of 3 or less intervallic directional changes.
Within the time constraint imposed on audio logos and singing range necessary for recall, intervallic changes add a level of creativity. Integrating this layer of motion may add to the uniqueness of an audio logo. However, too much complexity diminishes recall. The sample does support that audio logo designers chose, in most instances, to limit the amount of back-and-forth melodic motions.
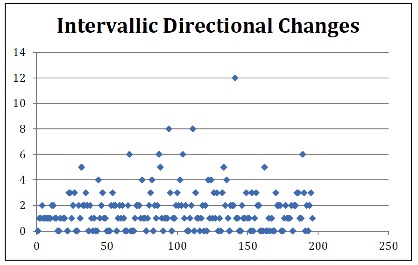
Figure 19. Intervallic Directional Changes Scatter Diagram for Sample n=196
On the other hand, a durational change is a rhythmic value change if any (See Table 4). In the case of the T-Mobile audio logo, there is no durational change because all events have a similar length, thus 0 (See Figure 18 and Audio File 11). A contrasting example is the Airtel audio logo (See Figure 20 and Audio File 12).
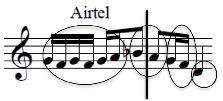
Figure 20. Airtel Audio Logo
Audio File 12
In that example, there are 3 durational changes. The first durational change happens on event 7, then another on event 9, and the final one on event 12, thus 3 durational changes as shown by the circles sketched on the sample. The results from Table 4 show that the most common durational change pattern in the sample is 2. The CVS audio logo is an example displaying such behavior (See Figure 10 and Audio File 7). In contrast, the example with the most extreme range of durational changes, covered by this study, is the ING-DiBa audio logo (See Figure 21 and Audio File 13). There, every event has a different durational length and thus changes constantly for the exception of two events that have the same length (circled in the figure) for a total of 13 changes. Alike intervallic changes, durational changes or the use of rhythmic diversity adds again to the uniqueness of an audio logo and can give that logo a semblance of grove, thus increasing recall.
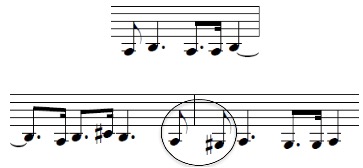
Figure 21. ING-DiBa Audio Logo
Audio File 13
The data shows that there is typically more variation in durational changes than in intervallic directional changes (See Figure 22). Indeed, most audio logos do not tend to include more than 4 durational changes, and most of the sample is restrained between 0 and 3 changes. Thus, the data supports that here is more variation done with durational changes than with intervallic directional changes, the number of events, pitches and pitch range. However, common attributes in all modality cues addressed thus far are clearly present and all play different roles.
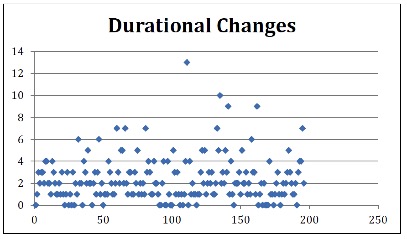
Figure 22. Durational Changes Scatter Diagram for Sample n=196
4.3 Structural Units
Structural units are a modality cue that considers whether there is one or two ‘units’ or ‘musical articulations’ within an audio logo. On a very basic level, a ‘unit’ or ‘musical articulation’ is a larger section of an audio logo than can be sung in one breath (Nattiez 1958, 11). Audio logos tend to be limited to one or two structural units because of their brevity and those that show two structural units are generally longer than the ones with one structural unit. As discussed earlier, most audio logos revolve around 5 events (See Table 3), thus, it is not a surprise to see that only 13% of the audio logos covered account for two structural units (See Table 5).
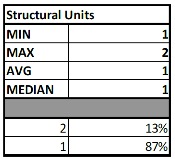
Table 5. Structural Units from Sample n=196
This analysis reveals that most audio logos (87%) consist of only one structural unit. Contrastingly, the McDonald’s audio logo (See Figure 1 and Audio File 1), the Müller Audio Logo (See Figure 12 and Audio File 9), the Airtel Audio Logo (See Figure 20 Audio File 12), the Haribo Audio Logo (See Figure 5 and Audio File 5), and the Miracoli Audio Logo (See Figure 24 and Audio File 14) are examples with two structural units. In each of those examples the units are clearly divided with a black vertical line, showing clearly when the first unit ends and when the second begins.
What can be the function and meaning of using two structural units? Perhaps the most effective reason is the idea of repetition, to enhance the audio logo’s mnemonic function or recall by repeating a melodic and/or rhythmic pattern several times (For an example of repetition, please refer to the Haribo Audio Logo in Figure 5 and Audio File 5). Another possibility for using two structural units would relate to the resolution of an audio logo. The topic of open-ended or close-ended resolutions will be addressed in section 4.4.
4.4 Resolution
The resolution modality cue distinguishes whether an audio logo is open ended or close ended, whether it concludes or remains non-conclusive. It is an important portion of this analysis from a structural perspective. Over 61% of the audio logos treated here remain open ended in their resolution (See Table 6).
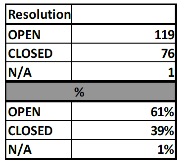
Table 6. Resolution Modality Cue for Sample n=196
A brand would choose to do so to unsettle its consumers and thus, entice the listener/viewer to learn more about the products and services or the brand in general. On the other hand, a brand would choose a close-ended resolution to make the listener feel at ease and content. Examples of close-ended resolutions are the McDonald’s audio logo (See Figure 1 and Audio File 1), the T-Mobile audio logo (See Figure 18 and Audio File 11), the Haribo audio logo (See Figure 5 and Audio File 5), and Miracoli audio logo (See Figure 24 and Audio File 14). Contrastingly, the Airtel (See Figure 20 and Audio File 12), Mr. Clean (See Figure 23 and Audio File 15), and St. Lukas (See Figure 25 and Audio File 16) audio logos are examples of open-ended audio logos.
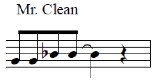
Figure 23. Mr. Clean Audio Logo
Audio File 15
4.5 Meters
The meter modality cue assesses whether an audio logo is in a binary, ternary or compound meter. In a binary meter, the beat can be divided in 2 and in a ternary meter it can be divided in 3. A compound meter is a combination of the two within a given measure. Most of the audio logos presented thus far have a binary modality cue. The Miracoli audio logo (See Figure 24 and Audio File 14) is one of the rare examples with a ternary meter. There, each beat, as circled in the example, is dividable by 3. Only seven audio logos, or 4% of the sample (n=196), are ternary and only one is in a compound meter (See Table 7). Thus 95% of audio logos transcribed in this study were in a binary meter.
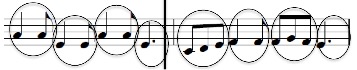
Figure 24. Miracoli Audio Logo
Audio File 14
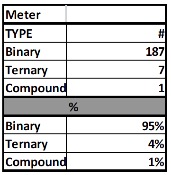
Table 7. Meters for Sample n=196
The only audio logo in a compound meter is the St. Lukas audio logo (See Figure 25 and Audio File 16). Please note, how there are seven equal events in the first measure with several possible subdivisions in a compound meter including 7 events: 2+2+3, 2+3+2, or 3+2+2, thus known as compound meter. The St. Lukas audio logo example uses the 2+2+3 subdivision to illustrate this concept (See circled subdivisions in Figure 25). Most of the music available worldwide is in a binary meter (2/4 or 4/4) including genres such as Rock, Pop, Country, and Blues. The dominance of the binary meter in audio logos helps create familiarity to support recall.
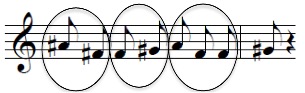
Figure 25. St. Lukas Audio Logo
Audio File 16
4.6 Tonal/Modal Centers, Finality and Modes
Most of the music available to us today is either tonal or modal. Tonal music can be in a major or minor key, whereas modal music uses other scales or pitch collections that do not have major or minor properties (Susanni and Antokoletz 2012, 66; Tagg 2003, 534; Shepherd, Virden, Vulliamy, and Wishart 1977, 156, Moore 1995, 187,191; Burns 2000, 213; Everett 2000, 331; and Terefenko 2014, 26). To assess whether an audio logo is in a major or a minor key, one needs to know the final note of the scale for that audio logo, also known as finalis or finality. In addition to the final note, the third note or third degree of the scale is also required. The third degree of the scale defines whether the scale is major or minor. The T-Mobile audio logo C-C-C-E-C, illustrates that process (See Figure 18 and Audio File 11). There, the note ‘E’ is the third degree of the ‘C’ scale, indicating that this audio logo is in C Major. Seeking to experiment with different modes can affect the mood (ethos) of the listeners significantly. Each key or mode has a different effect on moods (affect) and feelings. There is a great deal of research that has been conducted on the emotions associated with different keys 8. The emotions induced by various keys in audio logos are usually similar for most listeners. To illustrate this, C Major, as heard with the T-Mobile audio logo, could produce feelings of purity, simplicity and innocence (Schubart 1990; Jaquet, Danuser, and Gomez 2012; and Schubert 2007). Fit to brand and feelings associated with different keys or modes are most certainly an important starting point for audio logo designers. This begs for an in-depth study of feelings associations between audio logos and logo fit to brand. The data presented in this article could be an excellent foundation for such study.
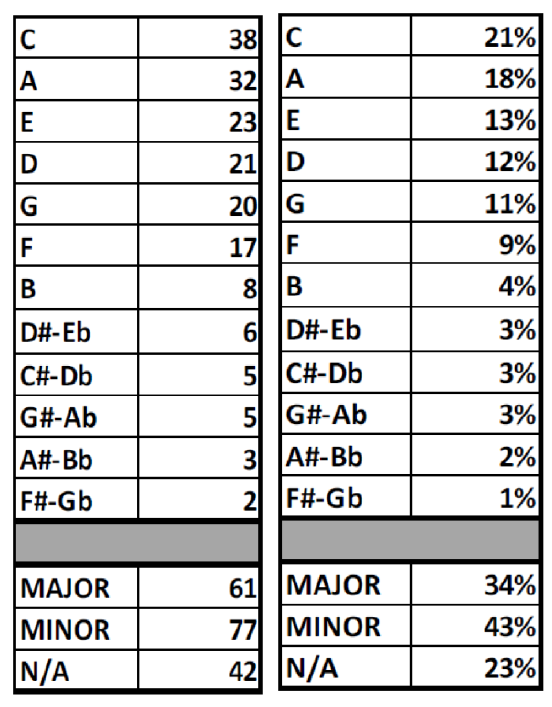
Table 8. Tonal/Modal Centers from Sample n=196 (with count and corresponding %)
However, in 42 instances or 23% of the sample transcribed, either the final note or the third degree of the scale were missing, or both, to assess whether the audio logos in question were in a major or minor key (See Table 8). Table 8 displays the most common final notes in the sample and whether the key was major, minor, or otherwise undefined. Indeed, when the third note of the scale was unavailable or the musical sample is modal rather than tonal, it was reported as undefined (N/A). What is most significant here, is the fact that 43% of the audio logos transcribed are in a minor key and only 34% in a major key, with 23% being undefined. Indeed, major modes/keys not minor ones are often thought of as more pleasing and positive (Weiss and Taruskin 1984, 1). This reinforces the assumption presented in the previous paragraph that brands want to trigger an unsettling feeling to keep their audience on hold and with an appetite for additional information about the brand and its offerings. The tonal/modal center is a significant clue for brands wishing to include licensed popular music songs in their commercials. Brands need to know, for example, that mixing a tune in a major key and ending with an audio logo in a minor key or on a different final note may have a distasteful effect and produce unwanted results. Thus, the production of an audio logo must be aligned with the long-term strategic sonic branding identity of the brand it is intended to.
Finally, this portion of the analysis shows what final notes are most commonly used in audio logos. The note ‘C’ accounts to 21% of the final notes for this sample, meaning that 1 out of 5 audio logos revolves around that pitch. Other important pitch centers are A (18%), E (13%), D (12%), and G (11%). The Social Network Analysis in section 4.7 will reveal additional common attributes linked to the most often used pitches (rather than final notes), tying them to the tonal/modal center seen in this portion of the analysis.
4.7 Social Network Analysis Pitch Application
Social Network Analysis (SNA) focuses on ties among agents, also known as nodes, within a network, in this case successive musical notes or pitches, to reveal patterns. Those ties combine to form networks, which are then analyzed (For more information about Social Network Analysis, please refer to Renard, Goodrich, and Rossiter 2010, 153-159; Renard, Goodrich, and Fellman 2012, 94-98, Renard, Faulk, and Goodrich 2013, 155-158, and Nooy, Mrvar and Batagelj 2005).
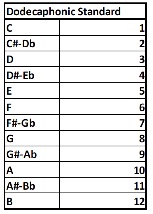
Table 9. Dodecaphonic Table with Numbers Corresponding to Notes to Match Coding Specification for SNA Modeling
Applying SNA to sequences of musical notes required first coding each pitch as a number from 1 to 12 to match coding specification with the network analysis program, Pajek9 (See Table 9). SNA requires that vertices, also known as agents or nodes, be coded with equivalent numbers. To do so each note needed to have a corresponding number. The best alternative was to use the dodecaphonic system, also known as twelve tone, coding system (See Table 9). Thus, each audio logo transcribed for sample n=196 for this study was coded in Pajek language and subsequently the visual simulation was processed on the Pajek program (See Figures 26 and 27). All pitches were entered in sequential format for all audio logos (See Appendix A). The results from this exercise, revealed the shortest path (See Figure 26) and longest path (See Figure 27), as well as the most commonly used pitches, and pitches that are most likely used in sequence or within the same audio logo.
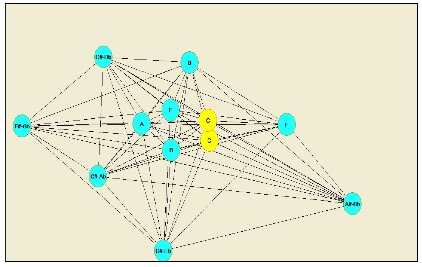
Figure 26. SNA with Shortest Path for Sample n=196
Figure 26 and Figure 27 are the exact same models but highlight different patterns. Figure 26 informs the reader that pitches ‘C’ and ‘G’ have the shortest path of all possible pitches, and thus are the most connected and most represented across audio logos from sample n=196.
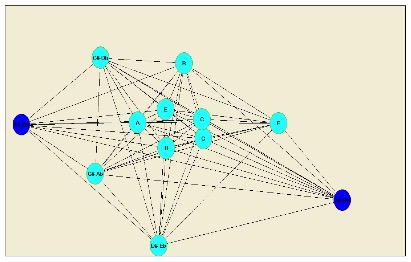
Figure 27. SNA with Longest Path for Sample n=196
Figure 27 reveals the opposite pattern. Indeed, pitches ‘F#/Gb’ (enharmonically equivalent)10 and ‘A#/Bb’ are the least likely of being sequential pitches in an audio logo based on the results from sample n=196. Pitches ‘A’, ‘E’, ‘D’, ‘C’, and ‘G’ are seen as most central in the network with peripheral pitches of lesser significance such as ‘F’, ‘B’, ‘C#/Db’, ‘G#/Ab’, and ‘D#/Eb’. What does this mean? Pitches that are most central are also pitches are the most commonly used in music in general. This informs us that audio logos are no different than rock, pop, classical music, or jazz. It also indicates that designers and brands want their consumers/listeners to be able to recall their audio logos, and do not wish to dissociate from their consumers’ sense of aesthetic and comfort zone (familiarity).
5.0 Results and Conclusion
Music branding is a rapidly growing area of increasing significance, and there is great opportunity in the production spectrum of audio logos. Through analyzing the concise list of important core attributes most frequently employed in the shaping of audio logos, this study revealed that only a limited range of variations are available to brands and agencies wishing to increase the uniqueness and recall of audio logos, setting a challenging environment to create a distinctive, recognizable and memorable audio logo (See Table 10). This study showed that only a small group of brands take the risk to create audio logos that fall outside of the typical modality cues range. It also validated the claims by Bronner, Hirt, Groves, Hofer, Bonde and Grutt Hansen, Ringe, and Raffaseder for the use of simplicity and of a melodic approach in audio logos. However, this study further added that this melodic approach is very limited and constrained to a few pitches and/or events, a short pitch range, and limited variations of motion as shown by the intervallic directional change and durational analysis.
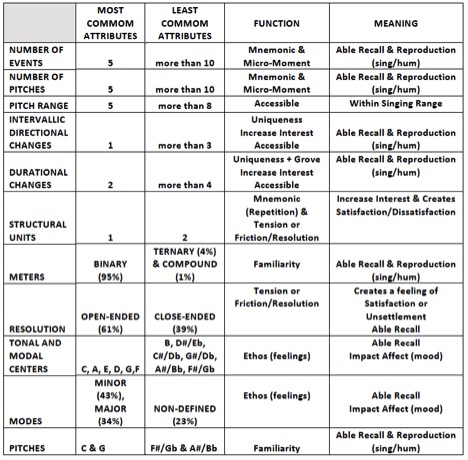
Table 10. Audio Logo Common Core Attributes Summary of Results
To further build the audio logo analytical literature, an extension of this study could bring forward additional attributes such as the perspectival depth modality, the use of instrumentation, absorption range, degrees of fluctuation and an in-depth analysis of sound design and special effects attributes such as pitch contour, durational contour, and dynamic range. Those important attributes could only reinforce the results presented here. This article is intended for those interested in audio branding and audio logos, and is a solid framework for academics and professionals interested in the musicological analysis of a song or a tune using sonic semiotics, those who intend to conduct market research on how consumers judge sounds and relate to musical pieces, and the associations that are elicited by such pieces. Fit to brand and feelings associated with different keys or modes are most certainly an important starting point for audio logo designers, and this area of focus begs for an in-depth study of feelings associations between audio logos and logo fit to brand. The data presented in this article could be an excellent foundation for such study.
Appendix A: Transcription Data
Notes
1Audio Branding Academy. 2016.
2 OHIM Trade Mark Number registered on 6/16/2009
3http://audio-branding-academy.org/aba/knowledge/overview-case-submissions-2010-2013/
5 GDP Ranking by the World Bank for the year 2014. Sourced on June 3rd, 2016
6 Pandora Advertising. 2016. Micro-Moments are Nice. Experiences are Unforgettable.
7 Centro interdipartimentale Mente/Cervello (CIMeC). 2014.
8 http://www.gradfree.com/kevin/some_theory_on_musical_keys.htm
9 http://reference.wolfram.com/language/ref/format/Pajek.html
10 http://www.thefreedictionary.com/Enharmonically+equivalent
Bibliography
1. Adams Laura, Elizabeth Burkholder, and Katie Hamilton. Micro-Moments: Your Guide to Winning the Shift to Mobile. Published by Google on Slideshare.net, September 25, 2015. Accessed January 18, 2017.
2. Boeriis, Morten Søndergaard. “Multimodal Socialsemiotik & Levende Billeder” [Multimodal Social Semiotics and Moving Images]. PhD thesis, University of Southern Denmark, 2009.
3. Bonde, Anders and Allan Grutt Hansen. 2013. “Audio logo recognition reduced articulation and coding orientation: Rudiments of quantitative research integrating branding theory, social semiotics and music psychology.” Sound Effects, 3(1+2) (2013):112-135.
4. Bronner, Kai. Audio-Branding: Akustische Markenkommunikation als Strategie der Markenführung. Munich: Grin, 2004.
5. Bronner, Kai. “Jingle all the Way? Basics of Audio Branding”. In Audio Branding: Brands, Sound and Communication, edited by Kai Bronner and Rainer Hirt, 77-87. Baden-Baden: Nomos, 2009.
6. Bruner, Gordon.C. II. “Music, mood, and marketing”. Journal of Marketing 54(4) (1990): 94-104.
7. Bundsgaard, J. “Bidrag til danskfagets it-didaktik. Med særligt henblik på kommunikative kompetencer og på metodiske forandringer af undervisningen”. [Contribution to the Educational Theory and Practice of IT in the Danish Subject in primary and lower secondary school]. PhD thesis, Copenhagen School of Education, 2005.
8. Burns, Lori. "Analytic Methodologies for Rock Music: Harmonic and Voice-Leading Strategies in Tori Amos's 'Crucify'". In Expression in Pop-rock Music: A Collection of Critical and Analytical Essays, edited by Walter Everett. New York: Garland Publishing, Inc, 2000.
9. Constantinou, Odysseas. “Multimodal Discourse Analysis: Media, Modes and Technologies”. Journal of Sociolinguistics 9(4) (2005): 602-618.
10. De Nooy, Wouter, Andrej Mrvar and Vladimir Batagelj. Exploratory Social Network Analysis with Pajek. Cambridge: Cambridge University Press, 2005.
11. Everett, Walter. “Confessions from Blueberry Hell, or, Pitch Can Be a Sticky Substance”. In Expression in Pop-Rock Music: A Collection of Critical and Analytical Essays, edited by Walter Everett, 269–346. New York: Garland Publishing, Inc, 2000.
12. Forceville, Charles. “Pictorial and multimodal metaphor in commercials”. In Go Figure! New Directions in Advertising Rhetoric, edited by Edward F. McQuarrie & Barbara J. Phillips, 272-310. Armonk NY: ME Sharpe, 2008.
13. Groves, John. “A Short History of Sound Branding”. In Audio Branding: Entwicklung, Anwendung, Wirkung akustischer Identitäten in Werbung, Medien und Gesellschaft, edited by Bronner, K., & Hirt, R., 40-51. Munich: Reinhard Fischer.,45-47, 2007.
14. Groves, J. “Sound Branding – Strategische Entwicklung von Markenklang”. In Marken-Management 2008/2009, edited by Meyer, H. Jahrbuch für Strategie und Praxis der Markenführung, 125-148. Frankfurt o. t. Main: Deutscher Fachverlag, 135-147, 2007.
15. Hoek, Leo.H. “La transposition intersémiotique pour une classification pragmatique”. In Rhétorique et Image Textes en homage à Á. Kibédi Varga, edited by Hoek, L.H., & Meerhoff, K., 65-80. Amsterdam: Rodopi, 1995.
16. Hofer, Julia. “Akustische Signale als Werbemittel im Hörfunk”. MA. Thesis, University of Vienna, 2009.
17. Jaquet Lucas, Brigitta Danuser, and Patrick Gomez. Music and felt emotions: How systematic pitch level variations affect the experience of pleasantness and arousal. Psychology of Music 42 (1) (2012): 51-70.
18. Lauer, Claire. “Contending with Terms: “Multimodal” and “Multimedia” in the Academic and Public Spheres”. Computers and Computation 26(4) (2009):225-239.
19. Levinson, Jerrold. “Hybrid Art Forms”. Journal of Aesthetic Education 18(4) (1984): 5-13.
20. Lusensky, Jakob. Sounds Like Branding. London: Bloomsbury Publishing, 2010.
21. Mitchell, W.J.T. “There Are No Visual Media”. Journal of Visual Culture 4(2) (2005): 257-266.
22. Moore, Allan F. "The So-called 'Flattened Seventh' in Rock". Popular Music 14(2) (1995): 185–201. Reprinted in Allan F. Moore, Critical Essays in Popular Musicology 283-300. Aldershot: Ashgate, 2007.
23. Nattiez, Jean-Jacques. In “Music and Discourse: Toward a Semiology of Music”, 1958. Musicologie générale et sémiologue, 1987. Translated by Carolyn Abbate, 1990.
24. North, Adrian C., David J. Hargreaves and Jennifer McKendrick. 1999. “The influence of in-store music on wine selections”. Journal of Applied Psychology 84 (1999): 271-276.
25. Perle, George. Serial Composition and Atonality: An Introduction to the Music of Schoenberg, Berg, and Webern, sixth edition, revised. Berkeley: University of California Press, 1991.
26. Raffaseder, Hannes.“Audio Brands and Brand Sounds: Relevance of Timbre in Audio Branding”. In Audio Branding: Brands, Sound and Communication, edited by Kai Bronner and Rainer Hirt, 95-107. Baden-Baden: Nomos, 2009.
27. Renard, Stan, Peter Spang Goodrich, and Philip Vos Fellman. “Historical Changes in the Music Industry Supply Chain: A Perception of the Positioning of the Artist Musician”. Journal of the Music & Entertainment Industry Educators Association 12(1) (2012):91-129.
28. Renard, Stan, Peter Spang Goodrich, and Nancy Rossiter. “The One Hundred Fifty Years of Change in the Music Recording Industry: An Historical and Social Network Analysis”. The International Journal of Knowledge, Culture and Change Management 11(1) (2011):151-162.
29. Renard, Stan, Gregory Faulk, and Peter Spang Goodrich. “Network Perspectives on the Relevance of New Revenue Streams in the Digital Era Music Industry”. Journal of the Music & Entertainment Industry Educators Association, 13(1) (2013):149-179.
30. Ringe, Cornelius. “Brands for Brands – How Much Do They Really Have to Fit?” In Audio Branding: Brands, Sound and Communication, edited by Kai Bronner and Rainer Hirt, 129-137. Baden-Baden: Nomos, 2009.
31. Shepherd, John, Phil Virden, Graham Vulliamy, and Trevor Wishart. Whose Music? A Sociology of Musical Languages. London: Latimer, 1977. Reprinted, Picataway, NJ: Transaction Publishers, 2008.
32. Schubart, Christian Friedrich Daniel. Ideen zu einer Ästhetik der Tonkunst. In Annual Bibliography of English Language and Literature. Olms, 1990.
33. Schubert, Emery. The Influence of Emotion, Locus of Emotion and Familiarity upon Preference in Music. Psychology of Music 35 (3) (2007): 499-515.
34. Straka, Martin. “Audio-Branding im actuellen Kontext der Marken-Kommunication: Zur Struktur und Funktion der Elemente von ‘Corporate Sound’”. Hamburg: Diplomica Verlag GmbH, 2007.
35. Susanni, Paolo, and Elliott Antokoletz. Music and Twentieth-Century Tonality: Harmonic Progression Based on Modality and the Interval Cycles. New York and London: Routledge, 2012.
36. Tagg, Philip. "Harmony". In Continuum Encyclopedia of Popular Music of the World Part 1 Performance and Production, edited by John Shepherd, David Horn, Dave Laing, Paul Oliver, and Peter Wicke. London & New York: A&C Black, 2003.
37. Terefenko, Dariusz. Jazz Theory: From Basic to Advanced Study. New York: Routledge, 2014.
38. Van Leeuwen, Theo. 1999. Speech, Music, Sound. London: Palgrave Macmillan, 1999.
39. Wallace, Wanda T. “Jingles in Advertisements - Can They Improve Recall?” Advances in Consumer Research 18 (1991): 239-42.
40. Weiss, Piero and Richard Taruskin. Music in the Western World: A History in Documents. Belmont: Thomson Shirmer, 1984.