
This paper is addressed primarily to those teachers of music history and music theory who, like myself, have had no professional training in education.1 Although there is every reason to believe that learning more about music can result in better music teaching, it is also true that learning more about teaching can be beneficial. Item Analysis is a tool that has proved to be helpful not only in evaluating students but in evaluating teaching as well.
Item Analysis tells two things about every question on a test. First it tells the proportion of students who answered a particular question correctly. Second and of greater usefulness, it tells the correlation (expressed as a value from -1.0 to +1.0) between a student's answering a particular question correctly and that student's total score on the test. The former figure is called difficulty, and the latter discrimination.
Intuitively, how difficult ought a test question to be? Ought it to be such that about half the class gets it right? Ought it to be such that only the smartest students get it right? Ought it to be such that almost everyone gets it right? The answers to these questions will be developed in the paragraphs that follow.
What kind of discrimination does one look for? The best questions are probably those that most of the good students get right and most of the poor students get wrong. Little is learned about the students from questions the correct answers to which are spread randomly over all the students. And questions that are answered correctly by more poor students than good ones should arouse a great deal of suspicion.
It should be made clear at the outset that this paper deals exclusively with teacher-made achievement tests, the results of which are used mainly to obtain a rank ordering of the students with regard to their knowledge of the subject matter. In more formal terminology, these are norm-referenced rather than criterion-referenced tests.2
Table 1 is a summary of a hypothetical examination of nineteen questions taken by twelve students.
TABLE 1. Responses, Difficulty, and Discrimination on a Hypothetical Examination
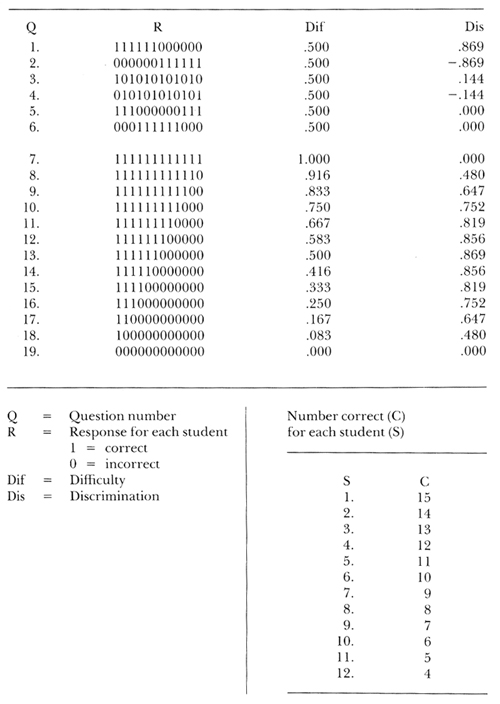
To the right of each question number is a series of twelve 1's or 0's. The 1's represent correct answers; the 0's represent incorrect answers. To the far right are the difficulty and discrimination for each question. At the bottom is the total number of correct answers for each student, found by summing the 1's in each column—column 1 contains the answers for student number 1, and so forth, across to student number 12. The columns are arranged in order of decreasing number of correct answers—there are more 1's in column 1 than in column 2.
Consider the first six questions. Each was answered correctly by six of the twelve students, so each has a difficulty of .5. Number 1 presents an ideal situation: all the top students got it right, and all the bottom students got it wrong. This one question is, in a sense, an index to the whole exam with regard to who is going to finish in the top half and who is not.
Question number 2 discriminates to the same extent, but in an extremely arcane way: who would attempt to divide up one's class by asking questions that only the poor students are going to answer correctly? It might not be immediately obvious how this could happen. One way is through a faulty key. After all, when making up a key for a long examination, there is a possibility of putting down a wrong answer every now and then. Item analysis helps spot that.
A question can also be phrased in such a way that a thoughtful student will be led to a wrong answer, whereas a weaker student will select the superficially correct answer. A third way that a distribution like this can come about is through the makeup of the class itself. Imagine a class in which the weakest students are, let us say, lute majors. And although they may not know much else, they really know lute literature. In the lectures perhaps little or nothing was said about lute music, but a question about it was asked on the exam. Under these circumstances, such a distribution is quite conceivable. The lesson to be learned is: Either revise the lectures to include the material, or drop the question from the test.
Questions 3 and 4 are about equal in their lack of discrimination—there appears to be no pattern to the responses. Questions 5 and 6 show grouped responses, but the groupings are such that they cancel each other. Of the six questions, only number 1 tells anything useful about the class.
On the remaining lines are the responses for the other thirteen questions; it must be kept in mind that the calculation of discrimination requires a knowledge of how all the students scored on all the questions. All in all it is not a bad test, for as the questions get harder it is always the better students who are answering them correctly. There are no questions with extremely low discrimination, but this by no means exhausts the number of ways that the answers could be distributed; in fact, there are 918 more ways in which precisely six correct answers from twelve students could be distributed.
The discriminations of questions 7 and 19 show that exactly the same is learned from a question that everyone gets right as from one that everyone gets wrong, namely nothing. There may be a psychological advantage in having a few questions that almost everyone can answer correctly, but for the purposes to which this test is to be put they are useless. On the contrary if we are going to take the time to write and check questions, and are going to ask the students to take the time to answer them, then we will probably want to be sure that we are getting the maximum amount of information from each question.
How can one insure that a question will have a high discrimination? Simple: one cannot. The questions themselves need to be tested. In fact professional testing organizations such as the College Entrance Examination Board are constantly revising, adding and deleting questions, not merely to be sure that they are asking the right questions but also to be sure that they are asking them in the right way. The first time one must ask a lot of questions, clear questions, unambiguous questions, questions over the material that has been covered in the lectures and in the students' readings. The good questions are kept, new ones are added, and poor ones are revised or discarded. Each time thereafter that a test is given over the same subject matter, the teacher can have greater confidence in the questions, in the test, in the results, and in the use of the results. If one tends to talk about what one knows one is going to ask about, and if one asks questions about what has been talked about, then the writing of lectures becomes easier.
Table 2 shows some specific questions from a test on Medieval music first given to 54 undergraduate students in a survey of Medieval, Renaissance, and Baroque music.
TABLE 2. Best and Worst Medieval Questions
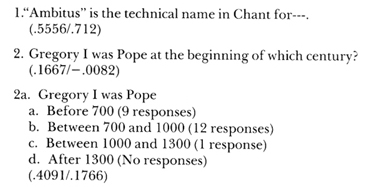
There were 96 questions on the test, and the average number correct was 54. In the following discussion, an ideal question is one with a difficulty of .5 and a discrimination of +1.0. Few questions meet these standards. Good or acceptable questions are in the range of difficulty from about .2 to .8 and above .4 in discrimination. By this definition, the best question was number 1, with a difficulty of .5556 (30 students answered it correctly) and a discrimination of .712. The worst question was number 2, with a difficulty of .1667 and a discrimination of -0.0082. A few months later an examination over the same period was given to 22 graduate students in a survey of Medieval, Renaissance, and Baroque music. That exam was made up of the best questions from the original exam—there were 45 of them—about 45 revised questions and about half a dozen new questions. The new questions were based mainly on material that had not been stressed with the undergraduates, primarily manuscript sources. These questions replaced an equal number of questions which for some reason defied revision. The mean score on the revised version was 67 correct, a distinct improvement.
The improvement was, I think, only partly due to the fact that the second group was made up of graduate students. The lectures, if not better, were at least more exam-oriented. The graduate students used a different textbook, and even though it contained more pages on medieval music there was probably less information to sort out relative to various levels of importance. But the most striking feature is that the correlation between the grades on the 45 old questions and the total 96 questions was .97; the rankings on the complete test compared to those on the subtest differed by no more than one position for 19 of the 22 students. Even though the correlation between the grades on a complete test and one of its subtests is likely to be high in any event, a correlation as high as .97 is unusual. This means that these 45 questions told about as much concerning the relative ranking of the students as the whole test did. In fact it might be telling more—who is to say which is the correct ranking of these students with regard to their knowledge of Medieval music?
The percentage of students correctly answering the question about ambitus dropped to 41%, and the discrimination dropped to .56, both still acceptable. The question about Pope Gregory was reworded as a multiple choice question, number 2a. Even though over half the students thought he was Pope between 700 and 1000, 41% did get him into the correct time period. It now remains to decide whether it is really important for students to know when Pope Gregory lived, within 300 years. If so, then it will have to be stressed more in the lectures.
Table 3 is intended to stress the fact that it is not easy to predict either the difficulty or the discrimination of an individual question.
TABLE 3. Questions of Approximately Equivalent Difficulty
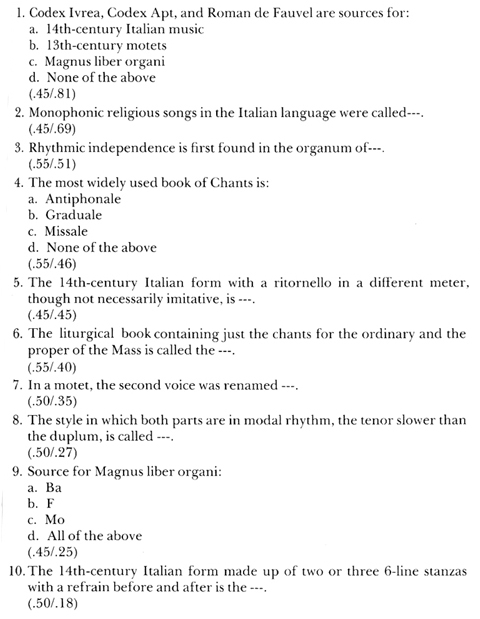
Each of these ten questions has about the same difficulty, between .45 and .55. The range in discrimination is extremely high, however: from .81 to .18. Obviously these questions are not all equally useful, in spite of their similarity in difficulty. Data like these are available from most centers that process machine-graded tests. Those teachers currently giving multiple-choice machine-graded tests are probably already getting them, or could be simply by checking a certain box on the submission sheet. Fortunately, item analysis does not make use of obscure statistics; any test-scoring center or computing center will know what is desired.
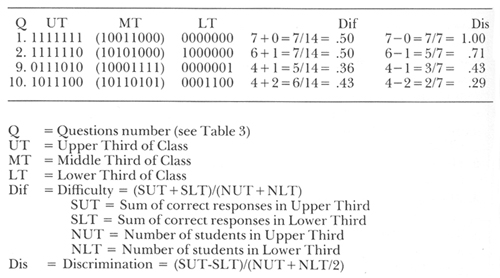
The figures in this paper were calculated by a computer. It would be quite tedious to carry out the same process by hand. However they are in many cases more refined than they need to be, and they can be approximated by hand if the class is not large and the test not extremely long. After marking the papers, put them in order from the highest to the lowest total score. Divide them into three groups, set aside the middle group, and concentrate on only the top one-third and the bottom one-third. To get the difficulty for any question, add together the number of correct responses in the two groups and divide by the total number of students in the two groups. To get the discrimination, subtract the number of correct responses in the lower group from the number of correct responses in the upper group and divide by half the total number of students in the two groups. That is more complicated to describe than it is to do. Table 4 shows how it would be done for questions 1, 2, 9, and 10 from Table 3.
TABLE 4. Calculating Difficulty and Discrimination by Hand
There are several subsequent uses to which these data can be put. The graduate class will take similar exams on the Renaissance and Baroque eras. The factual part of the final exam will be made up of 30 or so of the most discriminating questions from the period exams. The worst that can happen the second time around is that all the students will get them all correct, thus frustrating the purpose of the exam as expressed in paragraph 5. But would it be so bad if, one way or another, all the students had learned all this material? At any rate, there is little likelihood of this happening.3 The placement exam taken by all incoming graduate students will be made up of questions analyzed in this manner. And these questions will appear again on the history-literature part of the doctoral qualifying examination.
The total length of the period exams can ultimately be reduced through this process. Why ask—and grade—100 questions when 40 questions will give the same information about the students? By the time there are 100 or so good questions over a period, it will be possible to make up alternative forms of the exams and have confidence that they are more or less equivalent, a great convenience for use in large classes or for makeup tests. Poor questions will be continually revised and new questions will be added and evaluated. All of this will reveal what is being adequately covered in the lectures and what is not.
A few words about the philosophy of testing like this are appropriate in closing. As was stated near the beginning, it will show the rank ordering of the students with regard to their knowledge of the subject matter under consideration. It will not show how well a student can express himself verbally, but desirable though that skill may be, it is probably not one that is being taught in a music history survey. If verbal expression is an indication of how well a student can integrate the knowledge that has been presented, that can be tested if the questions are properly written.
Testing like this will preclude assigning grades on an arbitrary scale. Certain areas of the study of music require total mastery. One can demand that a student know, for example, the names of all the lines and spaces in the bass staff or the pitches of all the strings on the guitar. A guitar major could hardly pass with a D knowing the pitches of only 60% of the strings.
To be sure, it is legitimate to settle for only a predetermined percentage of correct answers in those areas in which total mastery is not critical and in which all the questions can be asked—the keys of all the symphonies of Beethoven, Brahms and Schumann for example, or the composers of the 100 most frequently performed operas. But in order to determine that a student has acquired 75% of the knowledge of music of the Middle Ages one must devise a test that asks for 100% of that knowledge. What constitutes 100% of the knowledge of Medieval music? That contained in the 566 pages of the new Hoppin book? In 502 pages of Reese? In 182 pages of Seay? In 135 pages of Grout? In 39 pages of the Wold and Cykler outline? Short of this one might try to concentrate on only the most important things. Are we certain enough of our sampling techniques and of our own lack of bias to be able to write 100 questions and be sure that they cover the 100 most important facts?
Our best hope is that the students will separate themselves into those who know a lot about the material, those who know something about it, and those who know very little about it. To achieve this we don't need to ask hard questions; we don't need to ask tricky questions. We simply need to ask lots of unambiguous questions. The students will take care of the rest.
1This article is a revision of a paper presented before the Southern Chapter of the American Musicological Society in Orlando, Florida on March 15, 1979. The revision incorporates several suggestions made by Professor Richard Williams of the Department of Educational Psychology, University of Miami.
2Cf. Richard H. Williams, "How to Improve Professor Made Tests," Improving College and University Teaching, Yearbook 1975, p. 165.
3This did not happen. Of 96 questions on the final exam, the number of correct answers ranged from 73 to 95, with a mean of 88. This in spite of the fact that the three period exams were reviewed in class, and the students retained those exams as study guides for the final.