Wall Street wants to change the fact that women remain the minority sex on the Street, because the financial world needs a diverse work force to make money and court clients especially as its clients are no longer homogeneous (New York Times 2006, p.1). Joe Gregory, President of Lehman Brothers was quoted in the article, You cant build a great company without great people, and great people are not just white, straight men aged 25 to 40. A study by Columbia Universitys Center for Work-Life Balance, which was also cited, concluded that white males represent a mere seventeen percent of the global talent pool of individuals with graduate education. (The New York Times, Sunday, August 6, 2006.). In public education, issues of language, testing, meritocracy, and immigration continue to provoke debates on either sides of mainstreaming and multiculturalism. Given higher educations historical leadership role in championing diversity and multicultural education, society looks to higher education for continued guidance.
The officers of The College Music Society have charged the Cultural Inclusion Committee to focus on the inclusiveness of our cultural diversities. The Committee has addressed diversity in a broader cultural context, as our daily work environments offer opportunities to deal with all kinds of cultural issues. Our thoughts turned to tapping into cultural diversity as a dynamic field of energy. The Committee actively pursued this new direction and offered our membership opportunities to brainstorm about cultural diversity as a core resource in the academic environment. Since the Committees inception two years ago, we have dealt with several key issues as they emerged from the annual CMS Conferences: minority participation at the conference; minority at the leadership level; methods and materials to teach diverse music; disparity between the local and national scenes; encouraging adjunct faculty participation; encouraging student participation; and minority faculty issues at home institutions. During this years Committee Forum, discussions converged into three themes: multicultural curricular issues; pedagogy and materials in teaching and performing; and mentoring, hiring, and retaining minority faculty. This article is based on the panel presentation in the session on "Mentoring, Hiring, and Retaining Minority Faculty" at the CMS Conference in San Antonio, Texas, September 1317, 2006.
Academic systems are guided by institutional culture and climate; and they are by nature complex, multidimensional, and subtle. Culture is deeply imbedded in academic traditions, common values, and beliefs; while leadership, events, trends, economies, and demographics of the time shape the climate. Within our departmental units, various cultural and climate systems operate that impact our work life directly. All these systems merit thoughtful consideration when we survey our diverse yet similar communities.
Political system: Male and female experiences are different in our departments, often as consequences of political systems that happen without deliberate design or intentions. Let us ask ourselves the following questions. Whether elected or appointed, do you have more male than female in your key decision-making committees? Do you have more female faculty in service-related committees such as curriculum, search, or special events? Do you have informal political systems in which women are silently excluded? Do tall people circle around and talk with each other to the exclusion of shorter people? These questions stimulate our sensitivities and at the same time increase our awareness of the political currents that shape both departmental direction and the individuals place.
Task system: Periodically departmental leadership may look closely to see if there are any naturally occurring patterns that set gender or ethnicity apart in the departmental task system, such as course assignment, office assignment, room allocation, committee assignment, and other specific role tasks.
Technical system: Are there subtle biases in Tenure and Promotion guidelines, evaluation and rewards systems favoring any sector among and within music disciplines? These issues may be felt but seldom recognized as important operating systems; nevertheless, they can determine individuals success and shape departmental dynamics.
Structural system: Is there balance of gender and race in the administrative structure? Are the deans and directors more often male, while associate deans and associate directors more often female? Is the majority of deans staff female, while the majority of the Executive Council male? Such demographics are shaped for the most part naturally and unconsciously. Recognizing them as symptoms of subtle discrimination is a first step toward achieving equity in work place.
My home institution, the University of South Florida, was ranked 18 best in diversity in The Princeton Review (2006), according to the Assistant Vice President of Decision Support. The first-day, Fall 2006 records showed the enrollment of 43,422 students, an increase of 1.7 percent over the enrollment of the first day of Fall 2005. The analyses indicated that the universitys student population was more ethnically diverse than ever (USF Bulletin, August 30, 2006). Percentages of undergraduate enrollment were 12.2% African American, 11.7% Hispanic, and 5.8% Asian, 0.4% American Indian, 2.5% nonresident alien, 64.9% white, with 2.4% not reported. Graduate enrollments were 7.5% African American, 8.5% Hispanic, 4.2% Asian, 0.3% American Indian, 11.1% non-resident alien, 67.3% white, and 1.1% not reported. Undergraduate gender ratio was 40.8% male with 59% female; and graduate ratio, 36.6% male and 63.1% female. (USF All Campuses Enrollment Profiles, Student enrollment, Fall, 2006.)
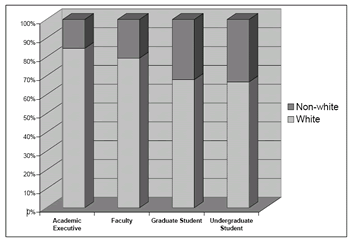
Statistics of faculty and academic executives were not readily available at this time, however summary statistics were composed based on the latest raw data available through the Office of Decision Support (Integrated Postsecondary Education Data System 2004-2005). Male faculty profiles show that of the total 783 male faculty, 69% (543) are tenured and 31% (240) not tenured. Of the total of 421 female faculty, the gender ratio for tenure is 53% (222) versus 47% (199). Among the academic executives with salaries over $100,000 (this group is comprised of out-of-unit, or non-faculty union, directors and deans), the gender ratio is 58% male and 42% female. The ethnicity breakdown is 85% white and 15% non-white.
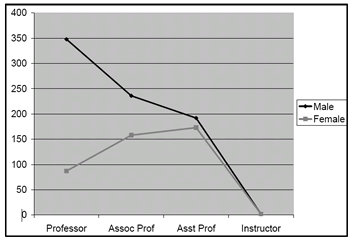
Comparison by rank shows a gender gap incrementally widening from 50/50% at the instructor level, to 80/20% at the full professor rank (see Table 1 & Chart 1). The gap between white and non-white also widens gradually from undergraduate (67/33%), graduate (68/32%), faculty (79/21%), to academic executive (85/15%) (See Table 2 & Chart 2).
The magnitude and consistency of gender and ethnicity gaps divulged in these summaries are unexpected; and I suspect this picture is not an exception among large public universities. The same leading higher education institutions strive to increase campus diversity by implementing special scholarships and incentive hiring programs, and student diversity will increase as American demographics change. However, employee diversity will require systematic and astute strategic planning if we are to embrace both the quantity and quality of diversity. Devoid of sound plans, a Provost¡¦s good intentions could easily be misfire.
Mary P. Rowe, a former ombudsperson at MIT, has identified three key equity issues on campus: 1) career and family, 2) safety and security, and 3) subtle discrimination. She reports that American workers and professionals worry about childcare and eldercare. While we generally recognize the importance of family, success at work and family life are in direct conflict in academia. Many people on campus continue to feel insecure about overt harassment and even assault. Subtle discrimination is clearly perceived but much more difficult to handle, because it is not legally actionable. Rowe offers several suggestions that could foster diversity on campus.
1) First we need extraordinary commitment from the top: She states that strong commitment at the president, provost, dean, and department head levels can make a real difference.
2) Consistent, personalized recruitment: Rowe suggests individually cultivating the best people with commitment to diversity and humane governance through year-in and yearout personal contact, mutual visits, telephone calls, and much collegiality.
3) Mentoring: Mentor's roles include opening doors, coaching, sponsorship, co-authoring, collaborative performance, giving a sense of history and standards, plain cheerleading, and inspiration. Cross-gender, cross-race mentoring works well; committed recruiters of minority faculty also work well as mentors. She suggests encouraging junior faculty to seek out mentors, preferably more than one. For example, a junior faculty member might seek a compatible mentor in another department in addition to an in-department mentor.
4) Networks: Professional associations are key to professional success. Professional networks can safely inform institutions what they need to know to change. And for individuals, networks provide comfort and personal support.
5) Family support programs: Institutions can consider flexible schedules, supportive maternity and family leave policies, part-time tenure and tenure ladders, shared jobs, dependent care information and referral, support for nursing mothers, and acceptance of male family caretakers. Rowe also points out that universities already have other means to change the campus culture and work climate to foster diversity and cultural inclusion such as women¡¦s studies, training programs, guest lectures and workshops. (Rowe, retrieved 9/3/2006.)
We hope that CMS efforts and initiatives will influence individual members to take leadership roles in creating culturally inclusive work environments in their home institutions. The Committee plans to produce a monograph series that deal with specific topics on philosophical, historical, or methodological issues, as well as specific genre or regional themes on cultural inclusion. The Committee invites interested members to submit monograph proposals that can contribute to cultural inclusion initiatives in the academic music professions. Please look for future Committee articles and announcements.
References
Integrated Postsecondary Education Data System 2004-2005. (Retrieved 9/3/2006.) http://usfweb2.usf.edu/fair/Reports/ipeds_ reports.asp?ipeds_report_type=K
Integrated Postsecondary Education Data System 2004-2005. (Retrieved 9/3/2006.) http://usfweb2.usf.edu/fair/Reports/ipeds_ reports.asp?ipeds_report_type=M
Rowe, Mary P. (Retrieved 9/3/2006.) http://aad.english.ucsb.edu/docs/Change6.html.
The New York Times, Sunday Business Section, August 6, 2006, The Fork in The Road: Can Women And Wall Street Live Together?
The Princeton Review (2006). New 2007 Best 361 Colleges Rankings, cited in personal e-mail by Michael Moore, Assistant Vice President of Decision Support, University of South Florida. Click here for web version.
The University of South Florida Bulletin, Volume 4, Issue 1, August 30, 2006. (Retrieved 9/3/2006.) http://usfnews.usf.edu/issue.cfm?id=3C965393-BDBE-2911-AA426931F2EDDA02
USF All Campuses Profiles, Fall 2006 Day One Enrollment Profile, Diversity Profile All Students. (Retrieved 10/15/2006.) http://usfweb2.usf.edu/infomart/eprofiles/currentprofile2/eProfilesUSFSystem.htm
Table Legends
Table 1 and Chart 1 - USF Faculty Gender Profile
Table 2 and Chart 2 - USF Ethnicity Profile
Table 1. USF Faculty Gender Comparison by Rank
| Male | Female | |
| Professor | 348 | 87 |
| Assoc Prof | 236 | 158 |
| Asst Prof | 192 | 173 |
| Instructor | 2 | 2 |
Chart 1. USF Faculty Gender Comparison by Rank

Table 2. USF Ethnicity Comparison: White/Non-white Ratio
* Non-resident alien and not reported are not included.
| White | Non-white | |
| Academic Executive | 165 | 30 |
| Faculty | 943 | 244 |
| Graduate Student | 5,377 | 2,524 |
| Undergraduate Student | 22,064 | 10,964 |
Chart 2. USF Ethnicity Comparison: White/Non-white Ratio


